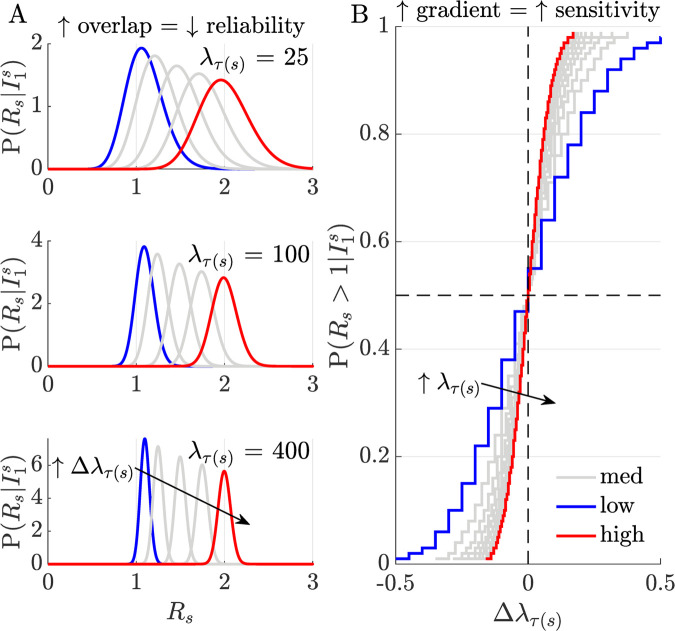
Fig 1. Relative sensitivity to perturbations in incidence.
Panel A plots posterior real-time distributions for time-varying reproduction numbers Rs, given incidence data , at different relative incidence perturbations, (increasing from blue to red). Here τ(s) represents some arbitrary window size used in computation (see Eq (2)). The degree of distribution separation and hence our ability to uncover meaningful incidence fluctuations from noise, improves with the current epidemic size, λτ(s) (i.e., as this increases from 25–400 overlap among the distributions decreases). Panel B shows how this sensitivity modulates our capacity to infer resurgence () and control (). If epidemic size is smaller, larger relative incidence perturbations are required to detect the same change in Rs (curves have steeper gradient as we traverse from blue to red). Resurgence (likely closer to the blue line in the top right quadrant) is appreciably and innately harder to detect than control (likely closer to the red line, in the bottom left quadrant).

