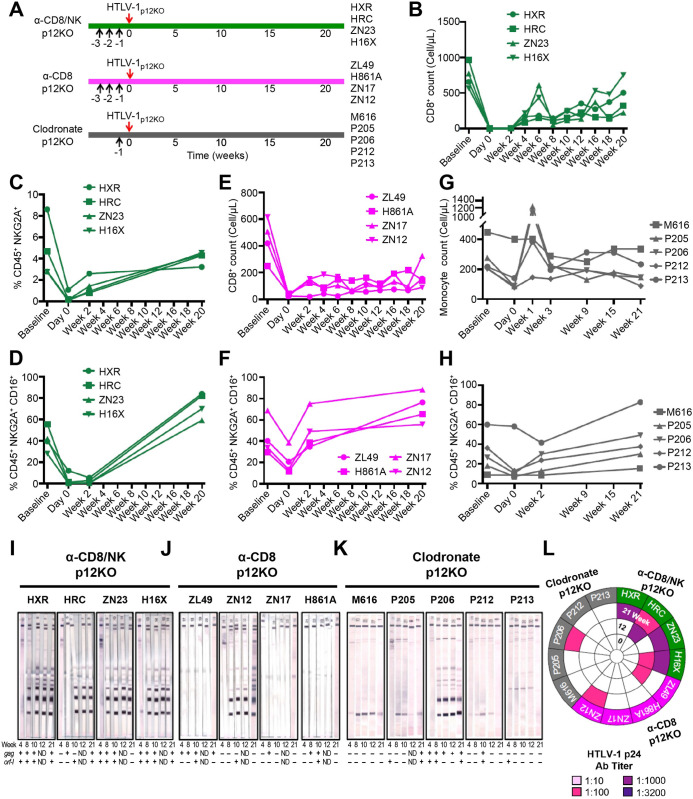
Fig 2. Restoration of HTLV-1p12KO infectivity by double NK/CD8+ cell depletion.
(A) Schematic of study design. Animals in the α-CD8/NK p12KO and α-CD8 p12KO groups were injected intravenously with M-T807R1 and CD8β255R1 respectively at 5mg/kg per day for three days prior to virus inoculation. Macaques in the Clodronate p12KO group were injected with Clodrosome at 20mg/kg one day prior to virus inoculation. Black arrows represent day of treatment with M-T807R1, CD8β255R1, or Clodrosome as indicated, and red arrows indicate inoculation with the lethally irradiated 729.6 lymphoblastoid B-cell lines producing HTLV-1p12KO. (B,E) Absolute CD8+ T-cell numbers shown before, during, and after the administration of M-T807R1 and CD8β255R1 in the (B) α-CD8/NK p12KO and (E) α-CD8 p12KO groups inoculated with HTLV-1p12KO at baseline, day 0, and after (weeks 2, 4, 6, 8, 10, 12, 16, 18, and 20). (C) Frequency of NKG2A+ cells identified as Singlets/Live/CD45+/CD3-CD20-/NKG2A+ measured before (baseline), during (day 0), and after (weeks 2 and 20) CD8+ cell depletion in peripheral blood of the α-CD8/NK p12KO group. (D,F,H) Frequency of NKG2A+CD16+ cells identified as Singlets/Live/CD45+/CD3-CD20-/NKG2A+CD16+ for the (D) α-CD8/NK p12KO, (F) α-CD8 p12KO, and (H) Clodronate p12KO groups inoculated with HTLV-1p12KO at baseline, day 0, and weeks 2 and 20. (G) Absolute monocyte cell numbers in the Clodronate p12KO group before (baseline), during (day 0), and after (weeks 1, 3, 9, 15, and 21) the inoculation with HTLV-1p12KO. (I,J,K) Sera from the inoculated macaques in (I) α-CD8/NK p12KO, (J) α-CD8 p12KO, and (K) Clodronate p12KO groups tested for reactivity to HTLV-1 antigens during the course of the study (weeks 4, 8, 10, 12, and 21). Animal ID, inoculated viruses, and treatment are indicated above each sample. The week of sera collection is indicated below each western blot strip. Positive amplification of either gag or orf-I in the blood throughout the course of the study is symbolized by (+); absence of amplification is symbolized by (-). (L) HTLV-1 p24Gag antibody titer was measured at weeks 0, 12, and 21. Dilutions of 1:10, 1:100, 1:1000, and 1:3200 were used and color-coded as reported in the figure.

