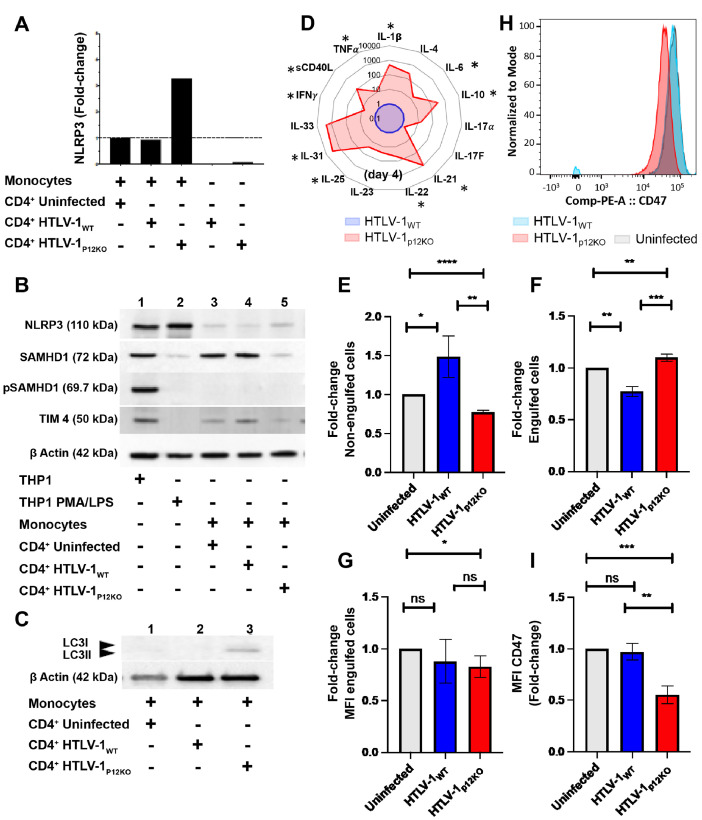
Fig 5. Differences in inflammasome activation and engulfment in monocytes exposed to HTLV-1p12KO and HTLV-1WT infected cells.
(A) NRLP3 mRNA from cDNA of monocytes co-cultivated with CD4+ cells (uninfected), CD4+ HTLV-1WT, and HTLV-1p12KO was assessed by Real-time PCR. Infected CD4+ cells used for the experiment were included in our analysis. Real-time PCR was performed in triplicate and samples were normalized to GAPDH expression. Fold-change was calculated by comparing values with monocytes co-cultivated with uninfected CD4+ normalized NLRP3 expression. (B) Western blot analyses of NLRP3 (110kDa), SAMHD1 (72kDa), pSAMHD1 (69.7kDa), and TIM4 (50kDa) expression from total cellular extracts of monocytes co-cultivated with uninfected CD4+ cells, CD4+ HTLV-1 WT, and CD4+ HTLV-1p12KO. THP-1 cells unstimulated and treated with PMA and LPS were included as controls. Protein loading was assessed by ß-actin expression. (C) Western blot analyses of LC3I/II (14–18 kDa) expression from total cellular extracts of monocytes co-cultivated with uninfected CD4+ cells, CD4+ HTLV-1WT, and CD4+ HTLV-1p12KO. (D) Spider chart of cytokines and chemokines measured in the cryopreserved supernatants from monocytes isolated from four different donors at three days post-co-cultivation. Cytokine level was analyzed using Bio-Plex Pro Human Th17 Cytokine Panel assays. The following targets were assayed according to the manufacturer’s instructions: IL-1β, IL-4, IL-6, IL-10, IL-17A, IL-17F, IL-21, IL-22, IL-23, IL-25, IL-31, IL-33, IFN-γ, TNF-α, and CD40L. The level of cytokines in the supernatant of HTLV-1p12KO exposed monocytes (isolated from four different donors) was graphed in red as a fold-change compared to the HTLV-1WT (blue). The average is shown in the figure. Asterisks (*) indicate cytokines that were found induced in all donors. Efferocytosis assay of THP-1 cells co-cultivated with HTLV-1 WT or HTLV-1p12KO infected cells or uninfected control cells (E,F). The bait cells, THP-1, were labeled with CytoTell Blue. Cells were then seeded in 12 well plates and treated with PMA. THP-1 cells were cultivated for 72 h with effector cells (729.6 cells, 729.6 producing HTLV-1WT, or 729.6 producing HTLV-1p12KO) previously stained with CFSE and lethally γ-irradiated. A well without effector cells was included for compensation and as a gating control. Fold-change of engulfed cells (CytoTell Blue positive and CFSE positive) and non-engulfed (CytoTell Blue negative and CFSE positive) cells were calculated from 3 independent experiments (see S8C Fig for an example of gating and cellular populations). The HTLV-1 proviral loads (PVL) of 729.6 producing HTLV-1WT and HTLV-1p12KO cells were 776% and 262% respectively. The p19Gag produced in the supernatant 729.6 HTLV-1WT and HTLV-1p12KO in 24 h measured 2832 and 939 pg/ml respectively. (G) Mean Fluorescent Intensity (MFI) of engulfed cells. Unpaired t-test was used for statistical evaluation. (H) CD47 staining of 729.6 cells, 729.6 HTLV-1WT and 726.9 HTLV-1p12KO cell lines. (I) Fold-change of MFI CD47 was calculated from 3 independent experiments. Unpaired t-test was used for statistical evaluation.

