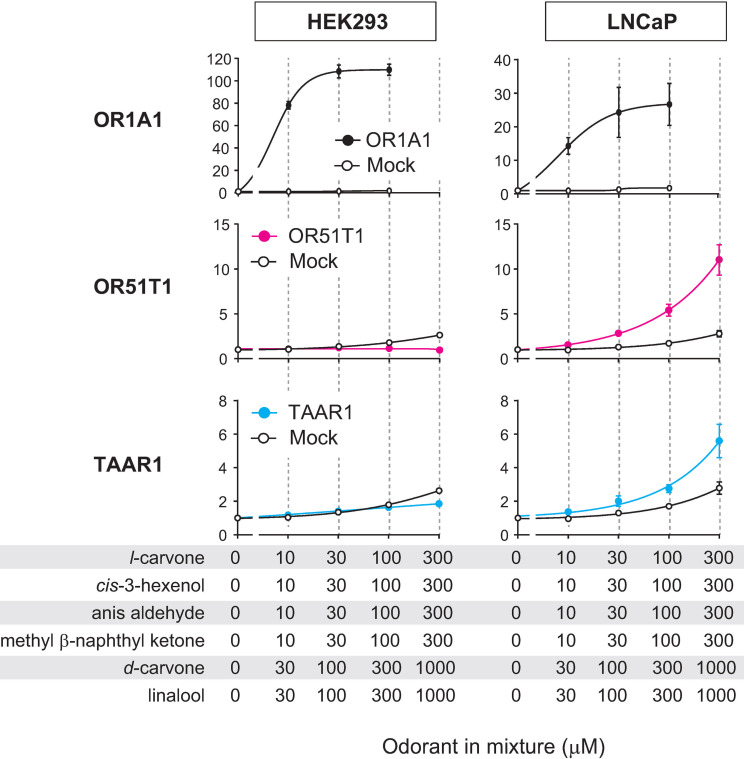
Fig 3. Activations of specific ORs were selectively monitored in LNCaP cells.
Dose-response curves of OR1A1 (top, black), OR51T1 (middle, magenta), and TAAR1 (bottom, blue) expressed in HEK293 (left) or LNCaP cells (right) against increasing concentrations of the odorant mixture. Each OR was co-transfected with CRE/luc2PpGL4.29, pRL-CMV, RTP1S and Gαolf. X-axis indicates final concentrations of each of the six components of the mixture. Ringer’s solution was used to dissolve the odorant mixture. Assays were also conducted on mock-transfected cells transfected with empty vector, CRE/luc2PpGL4.29, pRL-CMV, RTP1S, and Gαolf. (white). Y-axis indicates the fold increase in response. Data are shown as mean ± SE of three independent experiments.

