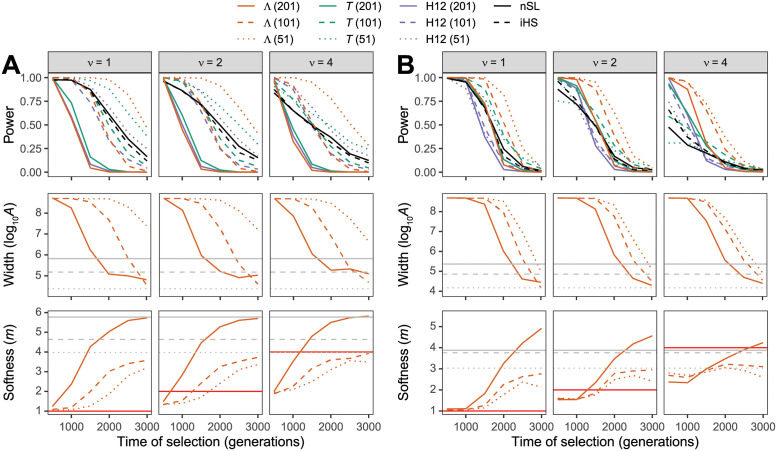
Fig 2. Performance of detecting and characterizing sweeps.
Performance for applications of Λ, T, and H12 with windows of size 51, 101, and 201 SNPs, as well nSL and iHS under simulations of (A) a constant-size demographic history or (B) the human central European (CEU) demographic history of [34]. Results are based on a sample of n = 50 diploid individuals and the haplotype frequency spectra for the Λ and T statistics truncated at K = 10 haplotypes. (Top row) Power at a 1% false positive rate as a function of selection start time. (Middle row) Estimated sweep width illustrated by mean estimated genomic size influenced by the sweep () as a function of selection start time. Gray solid, dashed, and dotted horizontal lines are the corresponding mean values for Λ applied to neutral simulations. (Bottom row) Estimated sweep softness illustrated by mean estimated number of sweeping haplotypes () as a function of selection start time. Gray solid, dashed, and dotted horizontal lines are the corresponding mean values for Λ applied to neutral simulations, and the red solid horizontal lines correspond to the number of sweeping haplotypes ν ∈ {1, 2, 4} assumed in sweep simulations. Sweep scenarios consist of hard (ν = 1) and soft (ν ∈ {2, 4}) sweeps with per-generation selection coefficient of s = 0.1 that started at t ∈ {500, 1000, 1500, 2000, 2500, 3000} generations prior to sampling. Results expanded across wider range of simulation settings can be found in S1–S3 and S7–S9 Figs as well as results for application to unphased multilocus genotype data in S4–S6 and S10–S12 Figs.

