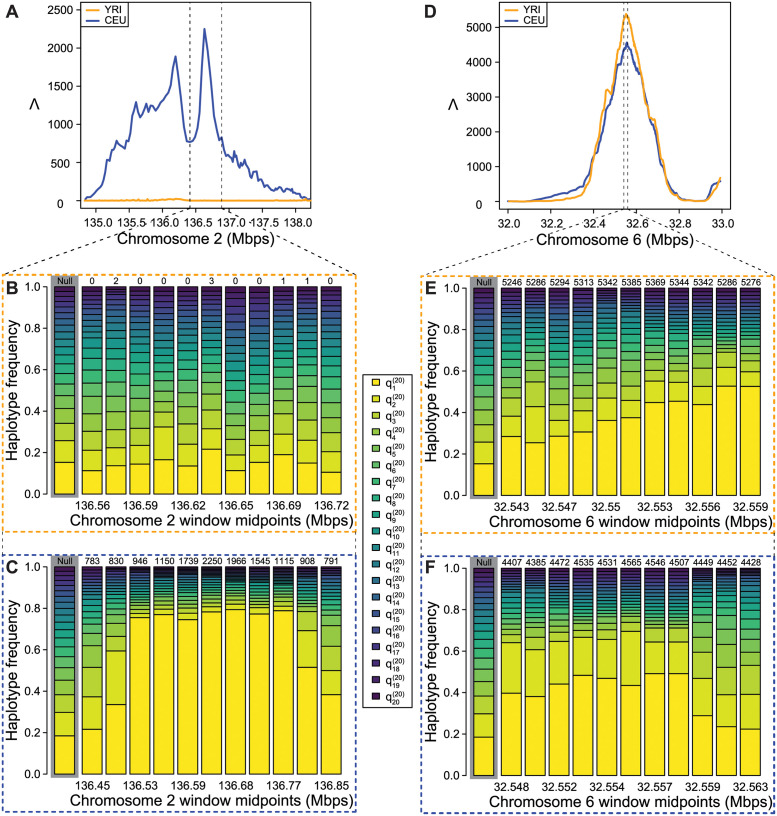
Fig 6. Detailed illustration of Λ statistics and haplotype frequency spectra in CEU and YRI.
(A) Λ plotted in the LCT region, vertical dotted lines indicate zoomed region shown in (B) and (C). (B) YRI empirical HFS for 11 windows in the LCT region. (C) CEU empirical HFS for 11 windows in the LCT region. (D) Λ plotted in the MHC region, vertical dotted lines indicate zoomed region shown in (E) and (F). (E) YRI empirical HFS for 11 windows in the MHC region. (F) CEU empirical HFS for 11 windows in the MHC region. In (B), (C), (E), and (F), numbers above HFS are Λ values for the window rounded to the nearest whole number, and the genome-wide average HFS is highlighted in grey. is the frequency of the ith most common haplotype truncated to K = 20.

