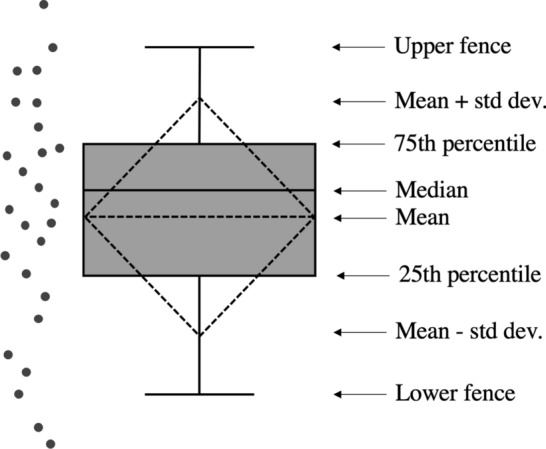
Fig. 4.

Elements of the box plot model used for reporting compactly the salient elements of a distribution: they report the 25th, 50th (median) and 75th percentiles, the mean value and standard deviation. The upper and lower fences represent values more and less than 75th and 25th percentiles (3rd and 1st quartiles), respectively, by 1.5 times the difference between the 3rd and 1st quartiles; values above upper fence or below lower fence are generally declared as outliers
