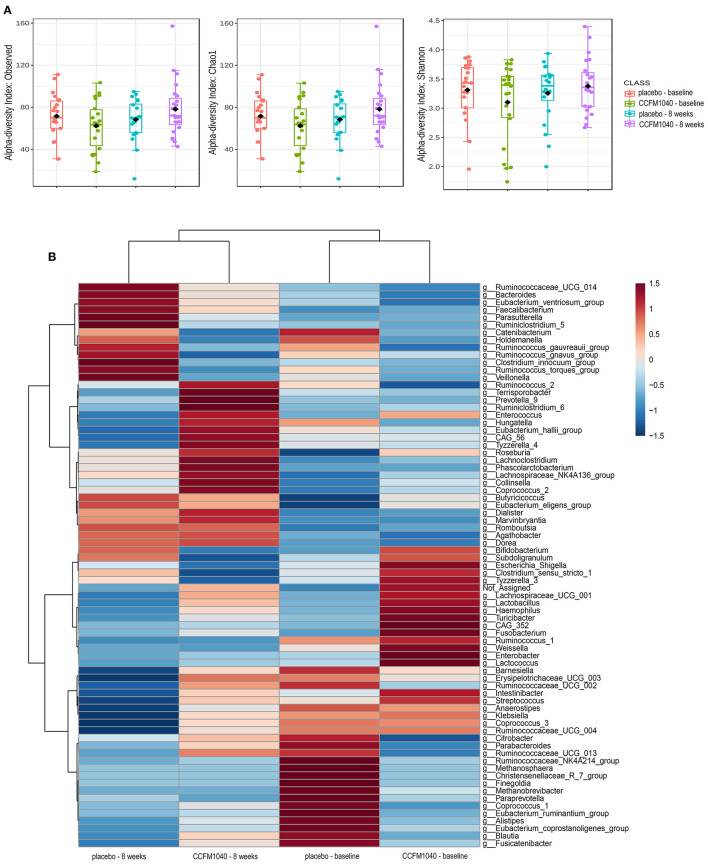
Figure 4.
Effect of CCFM1040 and placebo on the composition of the gut microbiota in patients with AR at the genus level. P < 0.05. (A) Boxplot for α-diversity measured based on observed, Chao1, and Shannon indices. (B) Heatmap analysis of species abundance clustering. The heatmap shows the rank based on abundance. Each column represents one group, while each row in the heatmap represents one genus. The red to blue color bar indicates the relative abundance. AR, allergic rhinitis.

