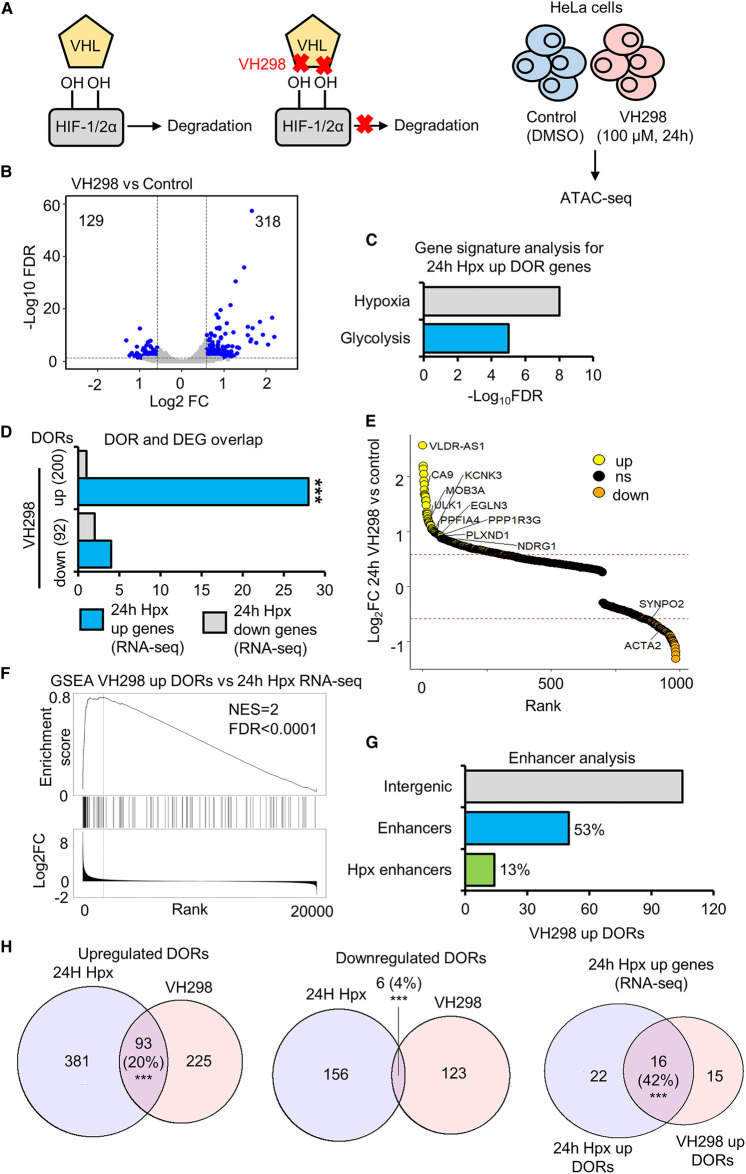
Figure 4. Chromatin accessibility changes in response to HIF stabilisation via VH298.
(A) ATAC-seq (n = 2) in HeLa cells cultured at 21% oxygen and treated with DMSO (control) and 100 µM VH298 for 24 h. (B) Volcano plot for differentially open chromatin region (DOR) analysis, blue points indicate high stringency DORs. (C) Gene signature analysis. (D) Overlap between genes with differentially open chromatin regions (DOR genes) in response to VH298 and genes with differential RNA expression (RNA-seq (n = 3)) (DEGs) in response to hypoxia. Statistical significance was determined via Fisher's exact test *** P < 0.001. (E) Gene list ranked from high to low fold change in chromatin accessibility in response to VH298. Up-regulated DOR genes are coloured yellow, down-regulated DOR genes are coloured orange. Some up-regulated hypoxia DEG and VH298 DOR genes and down-regulated hypoxia DEG and VH298 DOR genes are labelled. (F) GeneSet Enrichment Analysis between VH298 up-regulated OR genes and a list of genes ranked from high to low 24 h hypoxia RNA expression fold change. (G) Percentage of VH298 up-regulated DORs at intergenic regions that are active enhancers and active enhancers linked to the promoters of genes with 24 h hypoxia up-regulated RNA expression. (H) Overlap of VH298 and 24 h hypoxia DORs. Statistical significance was determined via hypergeometric test *** P < 0.001.

