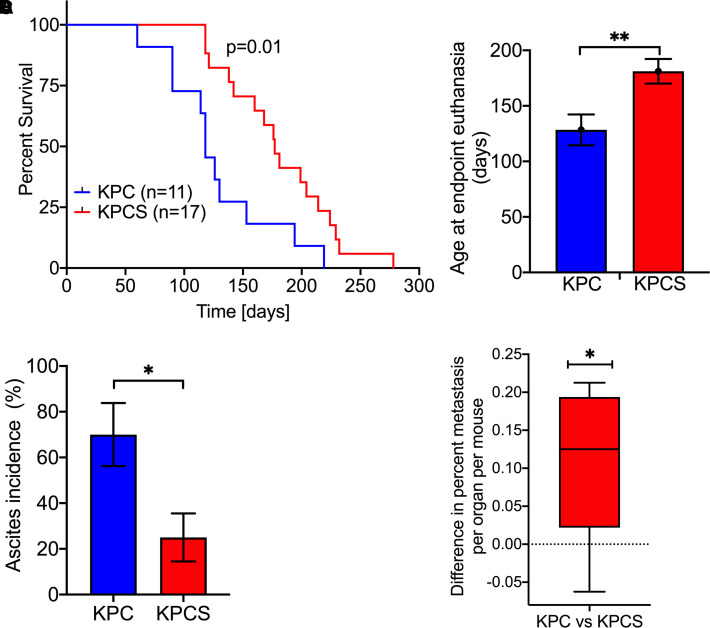
Figure 2. Deletion of Slc6a14 improves several parameters of PDAC in KPC mice.
(A) Kaplan–Meier curve showing survival outcome between KPC and KPCS mice. (B) Bar diagram showing age at endpoint euthanasia in KPC and KPCS mice. (C) Bar diagram showing ascites incidence in KPC and KPCS mice. (D) Box plot showing the difference in percent metastasis per organ per mouse between the KPC vs the KPCS mice. Data are given as mean ± SEM. *P < 0.05, **P < 0.01.

