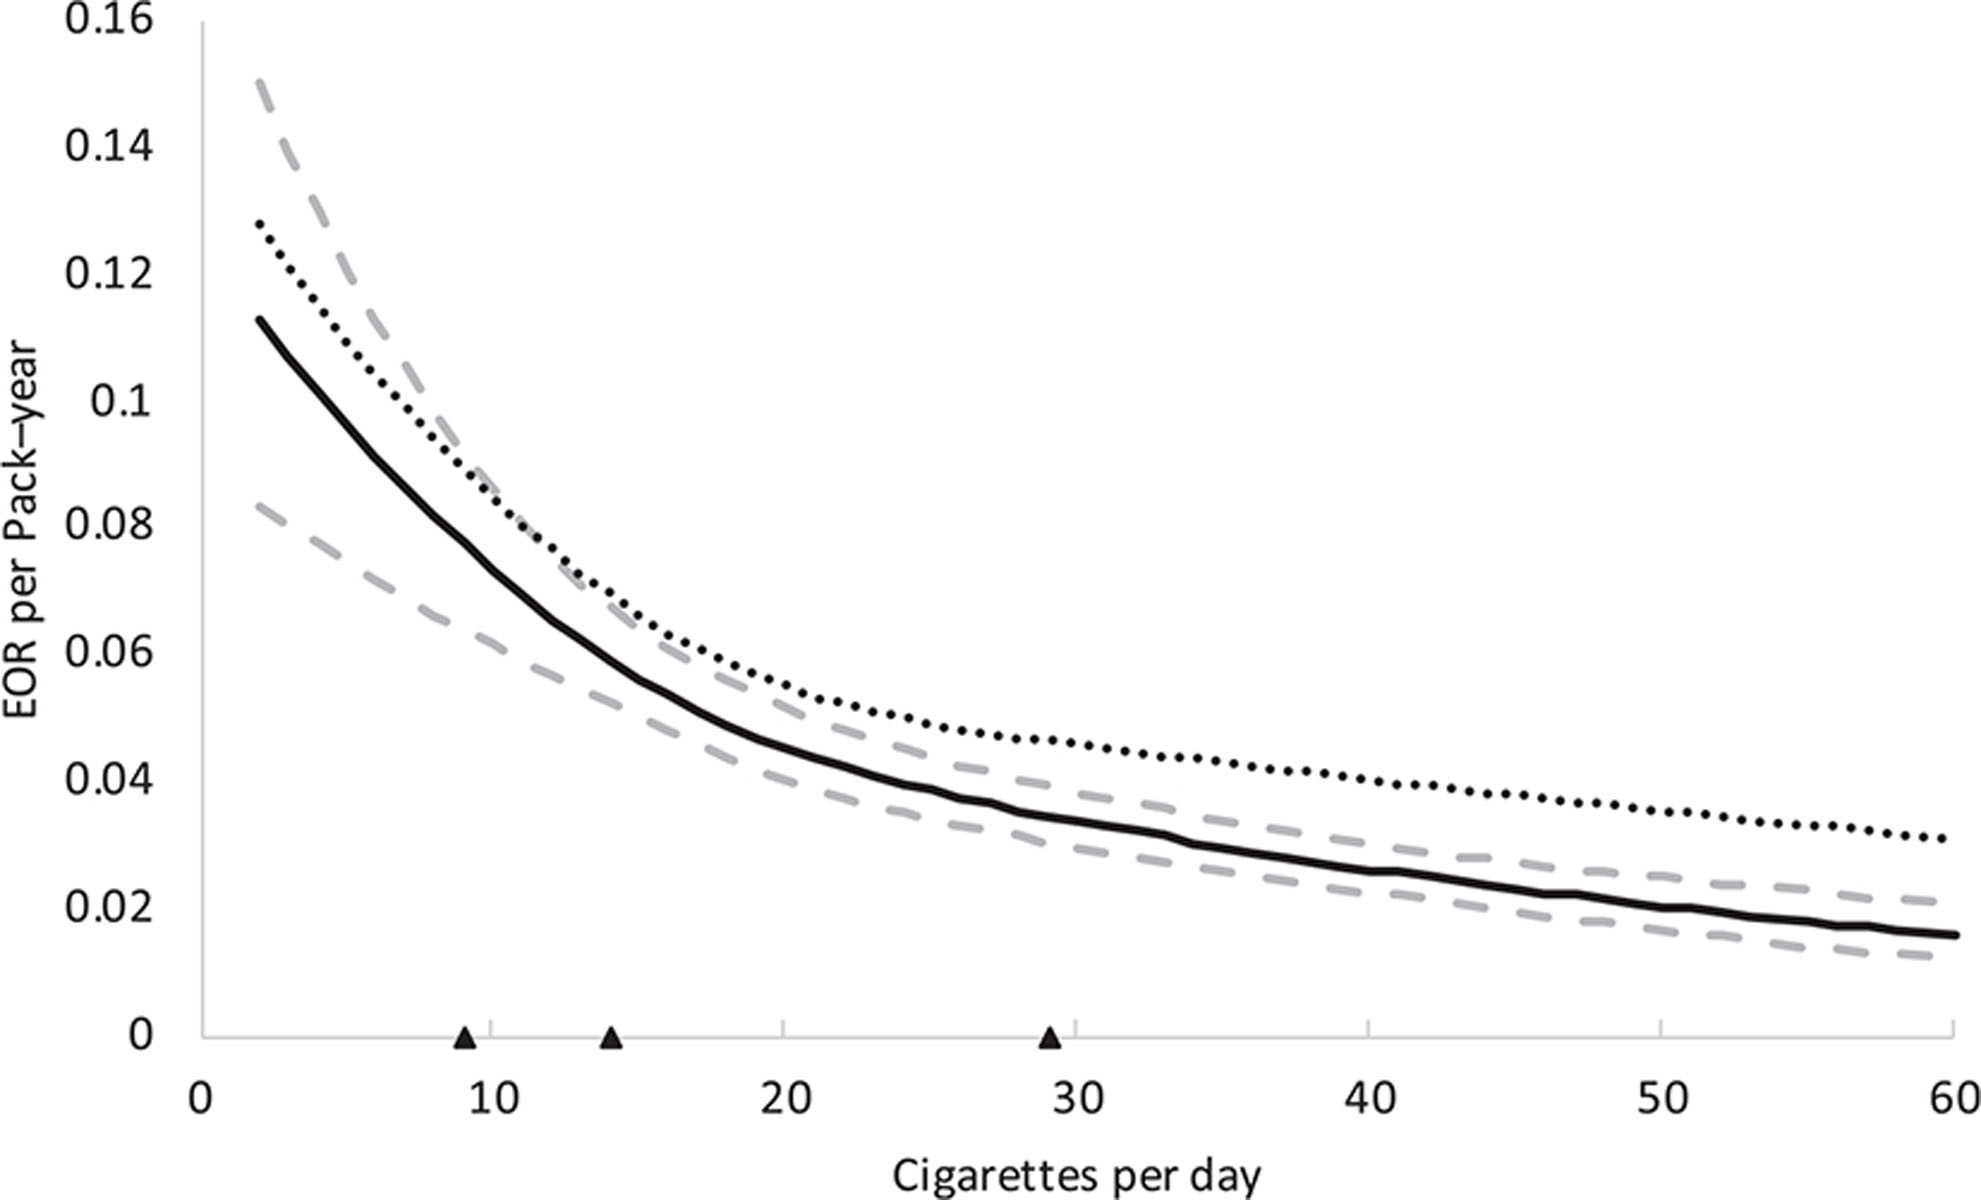
FIGURE 2.

Estimated excess odds ratio (EOR) per pack–year for bladder cancer by cigarettes per day with bootstrapped 95% confidence intervals. The dotted line indicates a model including an extra spline for time since smoking cessation. Triangles depict locations of the knots of the restricted cubic splines (20th, 50th, and 80th percentile).
