. 2022 Mar 30;11:e65820. doi: 10.7554/eLife.65820

Figure 2. Median and quantiles of proportion of time at the nest by treatment type (C or T).

(A) Proportion of time at the nest for males (T: n = 10 and C: n = 11). T-males spent 14% more time at the nest than C-males (GLMM Estimate 0.14 ± 0.05, p = 0.02). (B) Proportion of time at the nest for females (T: n = 14 and C: n = 9). T-females spent 15.8% less time at the nest than C-females (GLMM Estimate –0.16 ± 0.06, p = 0.02). A single dot represents the observations from one individual on a single night. For each individual, there are therefore three dots in the figure representing three nights (reflecting our GLMM analysis). There is no loss of statistical significance if data are analyzed with individual averages instead of repeated measures (see Appendix 1). Source data 1.

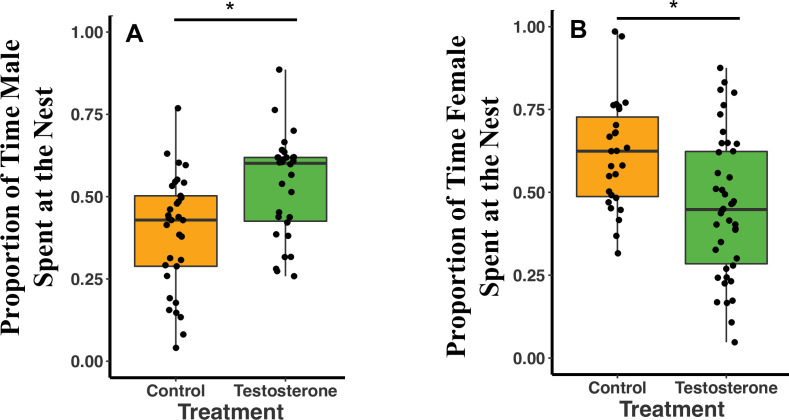
Figure 2.

Figure 2—figure supplement 1. Median and quantiles of male time at the nest by treatment type and by presence of pups.

Figure 2—figure supplement 1.

(A) C-male time at the nest with (n = 6) and without pups (n = 5). (B) T-male time at the nest with (n = 6) and without (n = 4) pups. T-males with pups spent 15% more time at the nest than C-male with pups, and T-males without pups spent 12% more time at the nest than C-males without pups (treatment GLMM Estimate 0.13 ± 0.03, p < 0.01; pups GLMM Estimate 0.21 ± 0.03, p < 0.01). A single dot represents the observations from one individual on a single night. For each individual there are therefore three dots in the figure representing three nights (reflecting our repeated measures GLMM analysis). There is no loss of statistical significance if data are analyzed with individual averages instead of repeated measures (see Appendix 1). Source data 1.
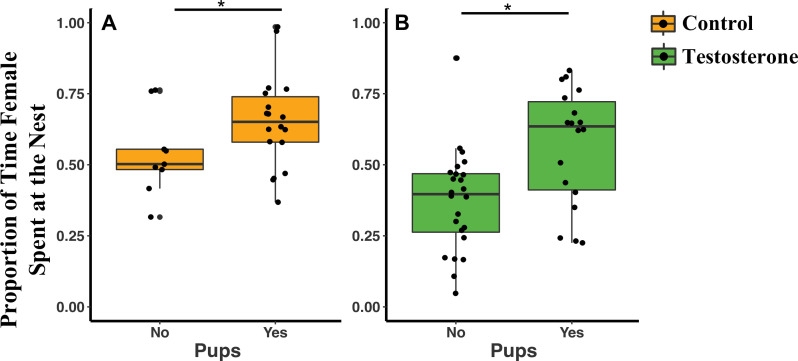
Figure 2—figure supplement 2. Median and quantiles of female time at the nest by male treatment type and by presence of pups.

Figure 2—figure supplement 2.

(A) C-female time at the nest with (n = 6) and without pups (n = 3). (B) T-female time at the nest with (n = 6) and without pups (n = 8). There was a significant effect of pups on female time at the nest (GLMM Estimate 0.54 ± 0.24, p < 0.04), but there was no treatment effect (GLMM Estimate –0.05 ± 0.25, p = 0.84). C-females with pups spent 11.6% more time at the nest than C-females without pups. T-females with pups spent 19.4% more time at the nest than T-females without pups. A single dot represents the observations from one individual on a single night. For each individual there are therefore three dots representing three nights (reflecting our repeated measures GLMM analysis). There is no loss of statistical significance if data are analyzed with individual averages instead of repeated measures (see Appendix 1). Source data 1.