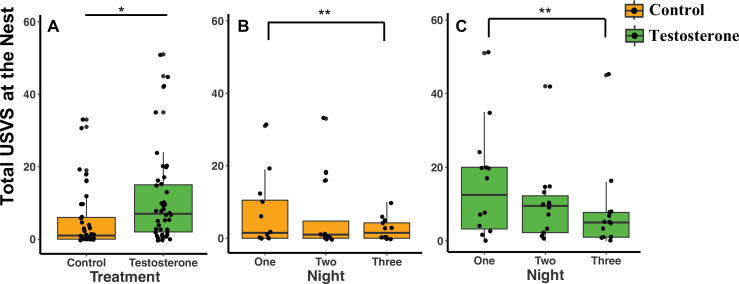
Figure 3. Median and quantiles of ultrasonic vocalizations (USVs) produced at the nest based on treatment and the three nights following the last injection.
(A) Pairs produced more total USVs at T-nests (n = 14 dyads) than C-nests (n = 12 dyads) (GLMM Estimate 0.87 ± 0.40, p = 0.04). (B and C) The number of total USVs produced by C-pairs and T-pairs decreased from night one to night three (GLMM Estimate –0.76 ± 0.26, p < 0.01). In figure (A) only, a single dot represents the observations from one pair on a single night. In figure (A), there are therefore three dots per pair representing each of the three nights (reflecting our repeated measures GLMM analysis). Figures (B) and (C) are broken down by treatment and by night and therefore each pair is represented by one dot per night. Source data 1.

