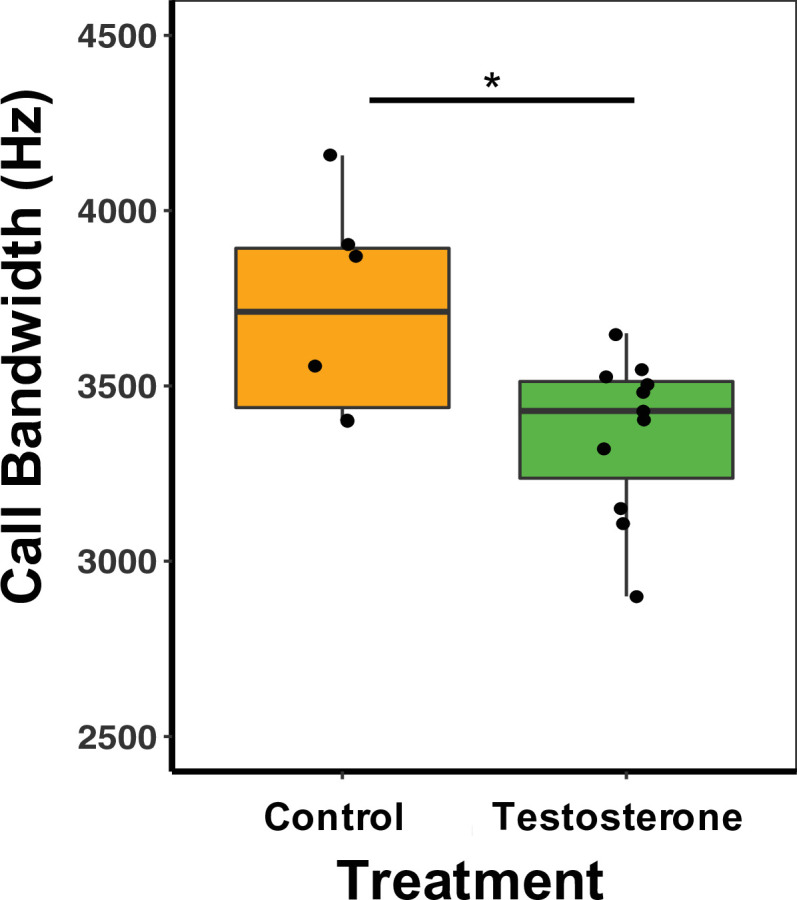
Figure 5. Median and quantiles of call bandwidth (Hz) for male mice.
Bandwidth was measured in the first call in the sequence for 1, 2-, 3-, and 4SVs produced by males. T-males (n = 12) produced calls with a 11.25% smaller bandwidth than C-males (n = 6) (GLM Estimate –0.13 ± 0.01, p < 0.01). A single dot represents the average bandwidth value for an individual male. Source data 2.


