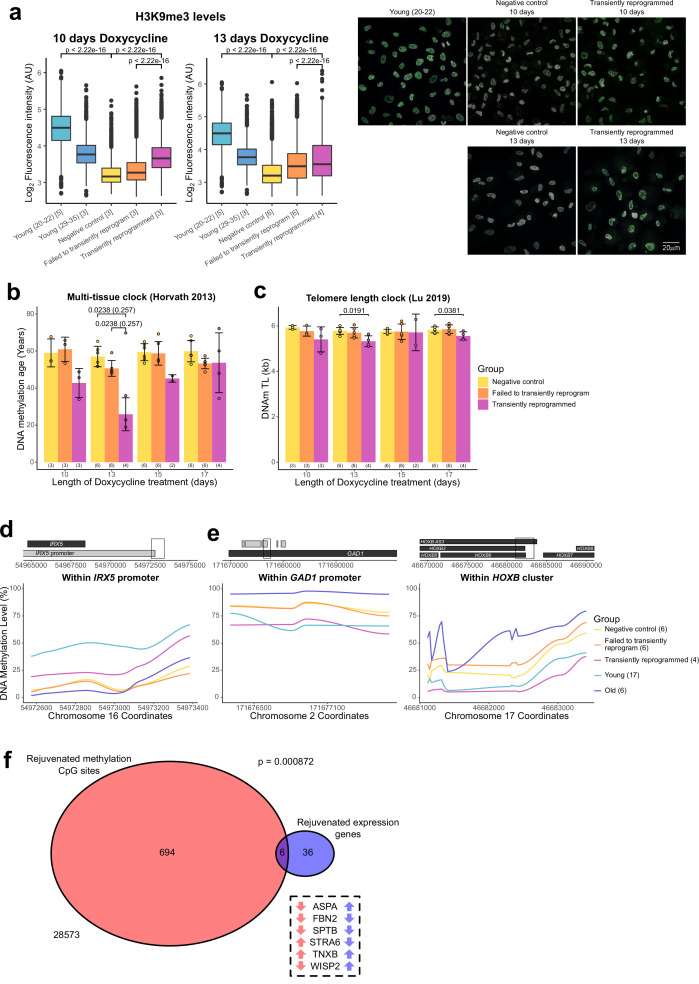
Figure 4. Optimal transient reprogramming can reverse age-associated changes in the epigenome.
(A) Boxplots of the levels of H3K9me3 in individual cells calculated based on fluorescence intensity within nuclei (segmented using DAPI). The levels of H3K9me3 were found to decrease with age and increase after transient reprogramming for 10 or 13 days. Boxes represent upper and lower quartiles and central lines the median. The number of distinct samples in each group is indicated in square brackets. Representative images are included (right panel). H3K9me3 is colored in green and DAPI staining is colored in gray scale. Significance was calculated with a two-sided Mann-Whitney U-test. (B) Mean DNA methylation age of samples after transient reprogramming calculated using the multi-tissue clock (Horvath, 2013). DNA methylation age substantially reduced after 13 days of transient reprogramming. Shorter and longer lengths of transient reprogramming led to smaller reductions in DNA methylation age. Bars represent the mean and error bars represent the standard deviation. The outlier in the 13 days of transient reprogramming group was excluded from calculation of the mean and standard deviation. Significance was calculated with a two-sided Mann-Whitney U-test with (in brackets) and without the outlier. The number of distinct samples in each group is indicated in brackets beneath the bars. (C) Mean telomere length of samples after transient reprogramming calculated using the telomere length clock (O’Sullivan et al., 2010). Telomere length either did not change or was slightly reduced after transient reprogramming. Bars represent the mean and error bars represent the standard deviation. Significance was calculated with a two-sided Mann-Whitney U test. (D) Mean DNA methylation levels across a rejuvenated age-hypomethylated region. This region is found within the IRX5 promoter. Samples transiently reprogrammed for 13 days were pooled for visualization purposes. The number of distinct samples in each group is indicated in brackets. (E) Mean DNA methylation levels across rejuvenated age-hypermethylated regions. These regions are found within the GAD1 promoter and HOXB locus. Samples transiently reprogrammed for 13 days were pooled for visualization purposes. The number of distinct samples in each group is indicated in brackets. (F) The overlap in rejuvenated methylation CpG sites and rejuvenated expression genes. Rejuvenated CpG sites were annotated with the nearest gene for this overlap analysis. The universal set was restricted to genes that were annotated to CpG sites in the DNA methylation array. Fisher’s exact test was used to calculate the significance of the overlap. The six genes that were found in both sets are listed along with the direction of their DNA methylation (red) and gene expression (blue) change with age.


