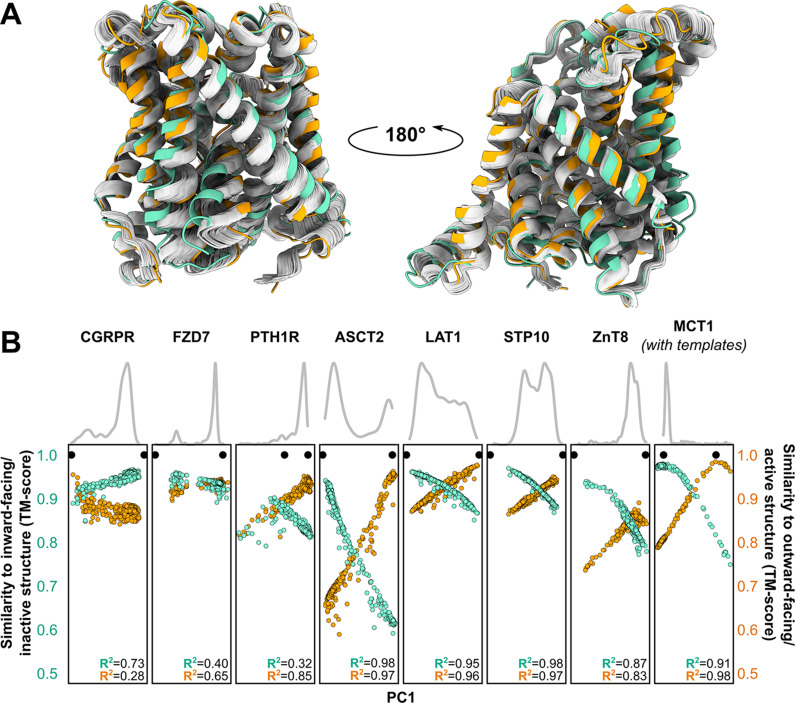
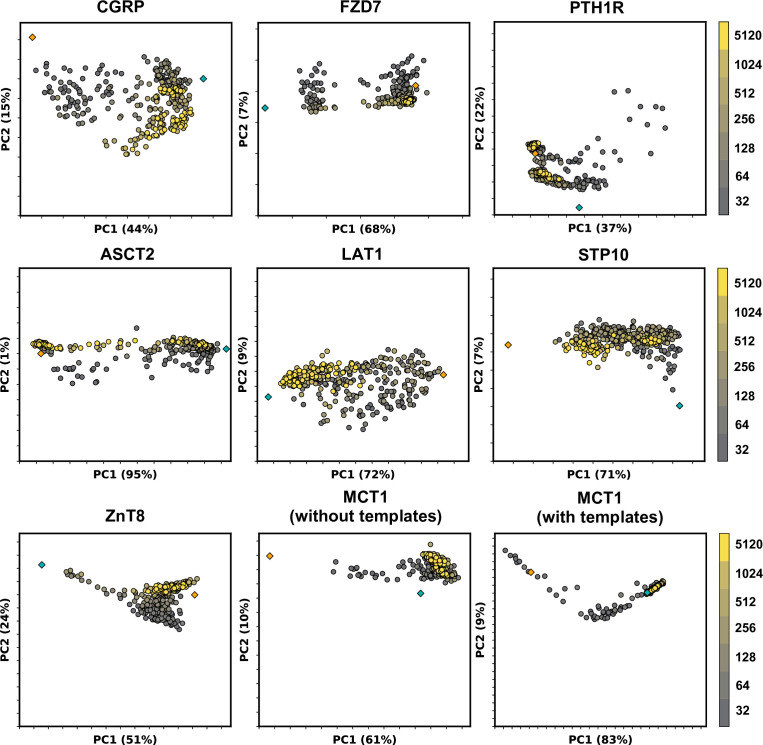
Figure 3. Distinct conformations can be delineated using principal component analysis (PCA).
(A) Conformational heterogeneity in AlphaFold2 (AF2) models of LAT1. Experimental inward-facing (IF) and outward-facing (OF) conformations shown in teal and orange, respectively, while the gallery of AF2 models generated using 128 sequences are shown in gray. (B) Distribution of AF2 models generated using multiple sequence alignments (MSAs) with 32 or more sequences across the first principal component (PC1) following PCA (gray traces). Scatter plots comparing each model’s position along PC1 and its structural similarity to experimentally determined structures. Teal: similarity to IF (transporters) or inactive (G-protein-coupled receptors, GPCRs) conformation. Orange: similarity to OF (transporters) or active (GPCRs) conformation. Each model is shown twice, once in teal and once in orange. Native structures are shown as black dots.


