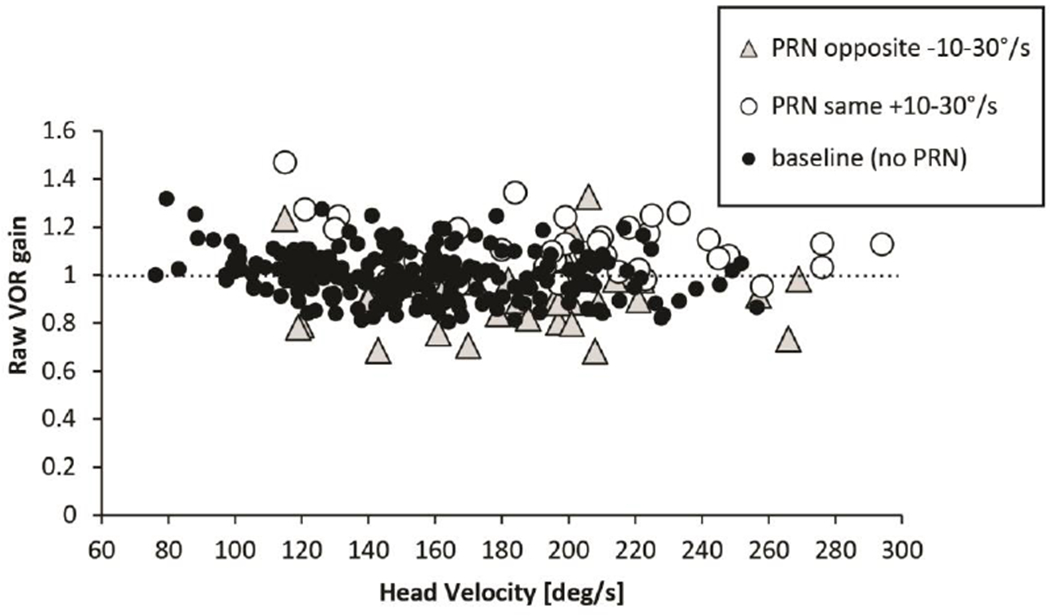
Fig. 4. ‘Raw’ VOR gain with low intensity PRN (<30deg/s).

Scatterplot illustrating ‘raw’, uncorrected VOR gain (a-c) as a function of head velocity with low PRN (range 10-30 deg/s). The regression coefficients of head impulses without PRN (baseline) were not significantly different than for test conditions with superimposed low intensity PRN (<30deg/s) when slow phases were in the same direction as the induced response to the head impulse but there was an effect when they were in the opposite direction.
