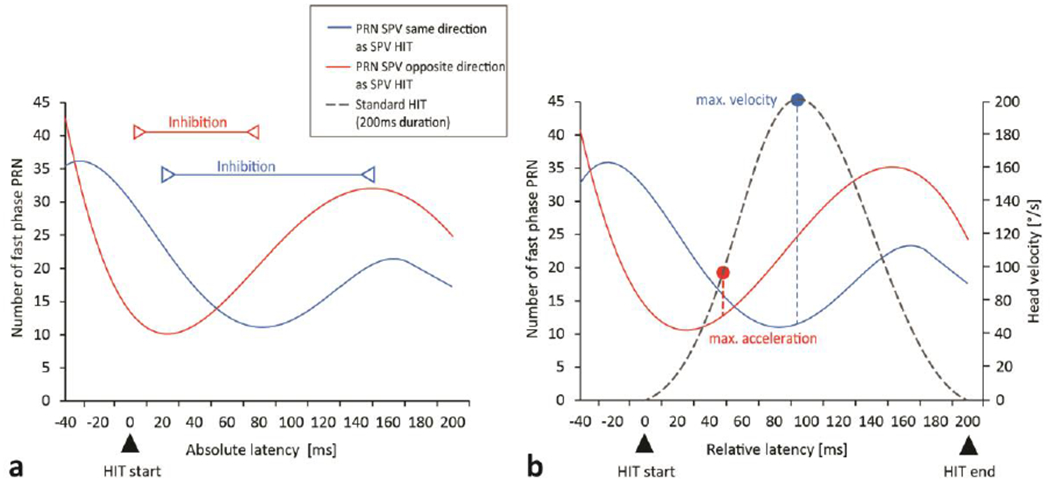
Fig. 7.

The frequency of quick phases of PRN appearing at a specific time just before and during a head impulse is shown in density plots for absolute latencies [based on actual HIT length] (a) and relative latencies [normalized to a standard HIT length of 200ms] (B). Zero milliseconds indicates the beginning of a head impulse (a and b), 200ms indicates the end of the normalized head impulse duration (b). Solid lines illustrate the frequency of PRN (slow phase) beating in the same direction (blue curves) to the slow phase HIT or in the opposite direction (red curves). The inhibitory time frame is shown by red and blue lines. Peak head velocity and acceleration are shown relative to the suppression of quick phases (b). There is no change between density plot a and b which indicates the suppression effect is also related to dynamic characteristics of the head and eye movements rather than just the specific time in the impulse response.
