Figure 3.
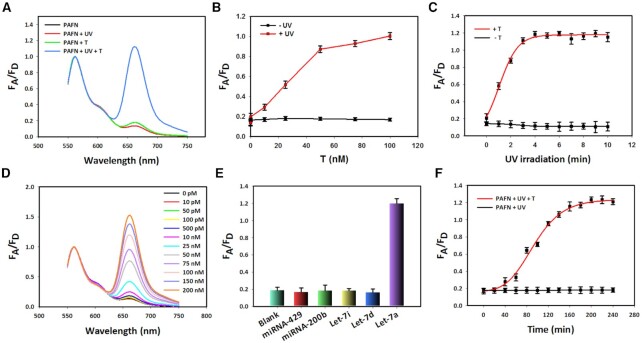
Characterization and sensing performance of the PAFN in tube. (A) Normalized fluorescence spectra of PAFN under different conditions. (B) FRET signal changes of PAFN function as various T concentrations with (red line) or without UV irradiation (black line). (C) Corresponding curve of PAFN responds to various illumination times in the presence or in the absence of T. (D) Normalized fluorescence spectra of PAFN change function as different concentrations of T, with the fueling of 300 nM F at 365 nm light irradiation. (E) Selectivity analysis of PAFN toward let-7a targets over other control miRNAs. (F) A fluorescence kinetic study of PAFN responded to let-7a or not after UV activation. FA/FD (FRET efficiency) is the fluorescence intensity ratio of acceptor to donor. Error bars represent three independent repeated experiments.

