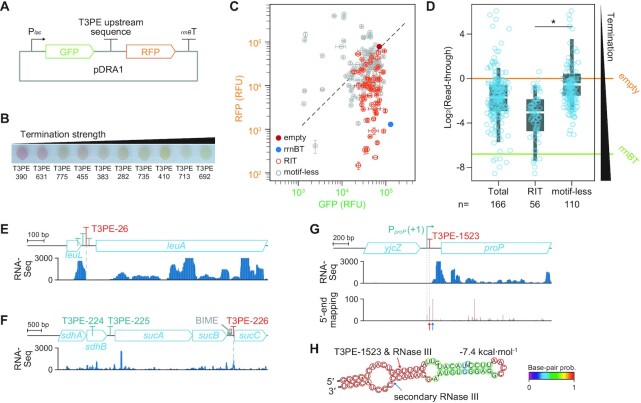
Figure 2.
Dual fluorescence reporter assay measurements of the transcription termination by upstream sequences of transcript 3′-ends. (A) Plasmid map of the dual reporter assay plasmid pDRA1. (B)Escherichia coli harboring different pDRA1 plasmids displayed different red fluorescent protein (RFP) expressions when grown on agar media. Low RFP expression indicates strong termination strength. (C) Monitoring the two different fluorescence signals revealed diverse termination activities of 150 T3PEs. Two signals were normalized by setting the green fluorescent protein (GFP) and RFP signals of pDRA1_empty to the same value. Error bars indicate the standard deviation of two biological replicate cultures. (D) Read-through distributions of T3PEs in the absence of a motif (motif-less T3PEs) revealed that T3PEs differed significantly from RITs. Read-through indicates RFP intensity divided by GFP intensity. *p-value: 0.0478 (Welch's t-test). Box limits, whiskers, and center lines indicate 1st and 3rd quartiles, 10th and 90th percentiles, and the median of the distribution, respectively. Circles indicate individual T3PEs. Colored horizontal lines denote read-throughs of pDRA1_empty and pDRA1_rrnBT. (E-G) Transcript profiles of T3PEs that are independent of canonical transcriptional termination. Transcripts with 3′-termini are products of (E) attenuation, (F) RNA stabilizing element, and (G) RNase III cleavage. Transcript 5′-end mapping supports the formation of an RNase III cleavage footprint. (H) Secondary structure of the 5′-untranslated region of proP mRNA. Arrows indicate the RNase III cleavage sites discovered elsewhere (42) and locations of T3PE-1523, which coincide with each other.

