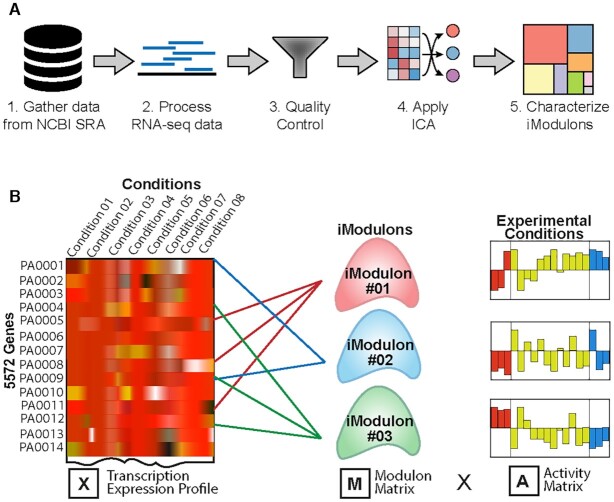
Figure 1.
Data analysis procedure. (A) Overview of the methodology used in the study. It includes gathering high-quality data from the NCBI-SRA as well as generated in the lab. The RNAseq reads were processed and quality control was done. Further, the independent component analysis (ICA) was applied to generate the iModulons that were characterized to get the regulatory networks of P. aeruginosa (Adapted from Sastry et al. (7)). (B) ICA calculates the independently modulated sets of genes (iModulons). A compendium of expression profiles (X) is decomposed into two matrices: the independent components composed of a set of genes, represented as columns in the matrix M, and their condition-specific activities (A).

