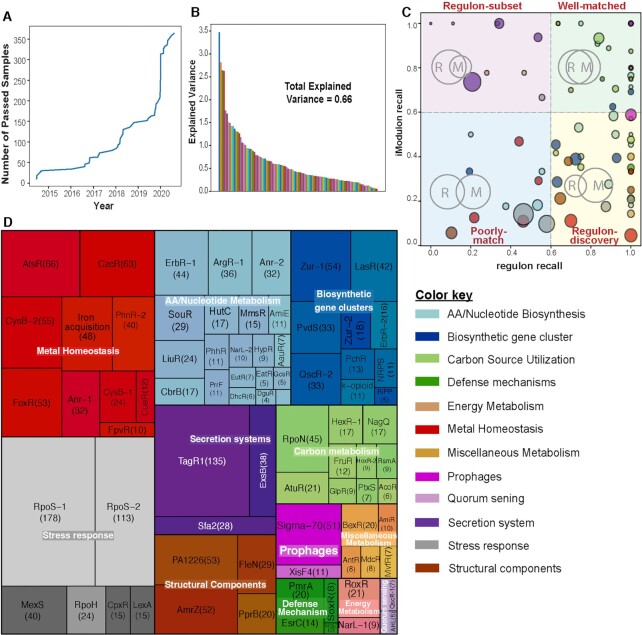
Figure 2.
iModulons computed from the Pseudomonas aeruginosa transcriptomic data compendium. (A) Plot showing the amount of passed samples per year which is used in the study. (B) Bar plot showing the explained variance in all the iModulons with overall explained variance of 0.66. Total Explained Variance is the sum of the fraction of explained variance across all iModulons. (C) Scatter plot showing the regulon recall versus iModulon recall for all 104 iModulons found in the P. aeruginosa dataset. The scatter plot is divided into four quadrants: Upper right represents the well-matched iModulons; upper left shows iModulons representing a regulon-subset; lower right depicts the regulon-discovery; lower left contains the poorly-matched iModulons. The size of the circle represents the size of the iModulons (number of genes) and the color represents the functional categories as shown in the color key. (D) Treemap of the 104 P. aeruginosa iModulons. The size of each box represents the size of the iModulons (number of genes) and the color shades of each functional category represented by the explained variance of each iModulon. iModulons are grouped into 12 different categories: AA/Nucleotide Metabolism, Biosynthetic Gene Clusters, Carbon Metabolism, Defense Mechanism, Energy Metabolism, Metal Homeostasis, Miscellaneous Metabolism, Prophages, Quorum sensing, Secretion systems, Stress Responses and Structural Components. Abbreviations: AA, amino acids.

