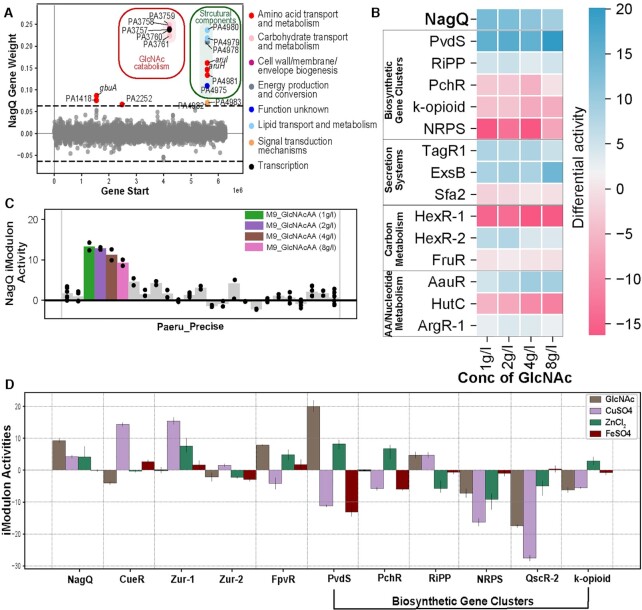
Figure 4.
iModulon responses to GlcNAc culture. (A) Scatter Plot showing the gene weights of the NagQ iModulon; the color depicts the COG categories. The NagQ iModulons have two regulons; one is GlcNAc catabolism and other is related to structural components. (B) Heat map depicting the activity of selected iModulons in different concentrations of GlcNAc (1g/l, 2g/l, 4g/l, and 8g/l). It describes the change in differential activities in NagQ, biosynthetic gene clusters, secretion systems, carbon metabolism, amino acid metabolism, and nucleotide metabolism. (C) Activity plot of the conditions expressed in NagQ iModulon in the Paeru_Precise. (D) Plot showing iModulon activities in the presence of N-acetyl glucosamine (GlcNAc), ZnCl, CuSO4 and FeSO4 micronutrients. The iModulons include the micronutrient metabolism (NagQ, CueR, Zur-1, Zur-2, FpvR) and the biosynthetic gene clusters (PvdS, PchR, RiPP, NRPS, QscR-2 and k-opioid).

