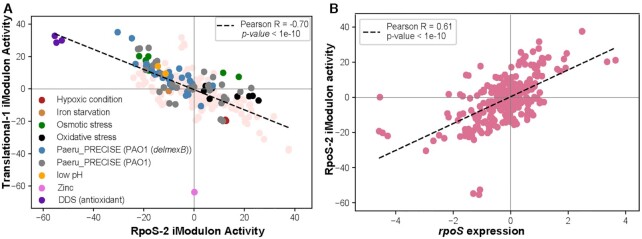
Figure 7.
Fear versus Greed trade-off relationship between iModulons. (A) The RpoS-2 iModulon activities were anti-correlated with the Translational-1 iModulon activities. All the stress conditions (hypoxia, iron starvation, osmotic stress, oxidative stress, and low pH) were highlighted with different colors. (B) Scatter plot showing correlation between the RpoS-2 iModulon activity and the rpoS gene expression with the Pearson's correlation coefficient of 0.61.

