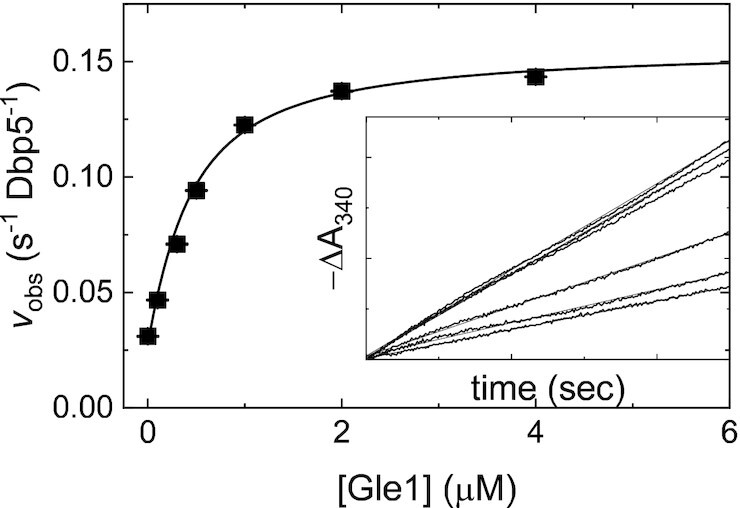
Figure 1.

Gle1-stimulated steady-state ATPase activity of Dbp5. [Gle1]-dependance of the Gle1-stimulated Dbp5 steady-state ATPase rate (vobs) per enzyme. The continuous line through the data represents the best fit to Equation (2.9) in (31) yielding the maximum observed velocity vobs per enzyme (kcat= 0.16 ± 0.01 s–1 Dbp5–1) from the amplitude and KGle1 (apparent KM= 0.3 ± 0.1 μM) from the [Gle1] at half-maximum velocity (Table 1). Uncertainty bars represent standard errors in the fits and are contained within the data points. Inset: Time courses of absorbance change at 340 nm assayed with the NADH-coupled assay after mixing 200 nM Dbp5 (100 nM after mixing) and 30 mM ATP (15 mM after mixing) with various [Gle1] (0–4 μM after mixing). The continuous lines through the data represent the best fits to linear functions, yielding the steady-state ATPase rate from the slopes. InsP6 is included in all experiments at an equimolar concentration with Gle1.
