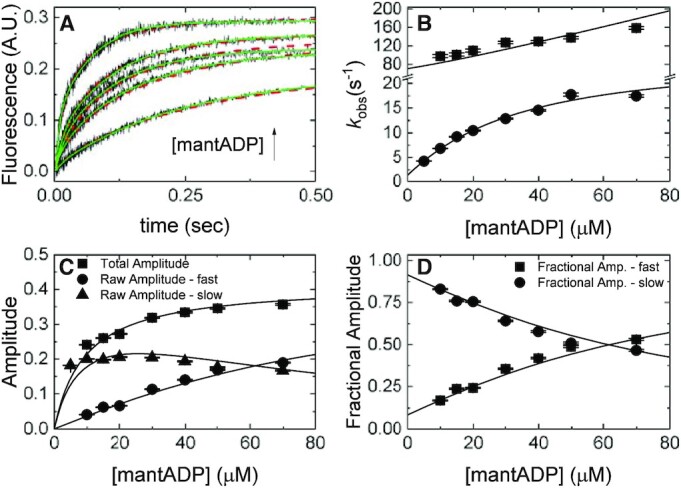
Figure 4.

mantADP binding to Gle1–Dbp5. (A) Time courses of FRET signal changes in pre-equilibrated solution of 1 μM Dbp5 (0.5 μM after mixing) with 20 μM Gle1 (10 μM after mixing) upon rapidly mixing with an equal volume of various concentrations of mantADP (5–70 μM after mixing). Continuous lines through the data are the best fits to either double exponentials (solid lines) or global fits (with data from Figures 2B and 3) to a kinetic simulation of Scheme 1 (dashed lines). (B) [mantADP]-dependence of the observed rate constants for mantADP binding pre-formed Gle1–Dbp5 complex. Continuous lines through the data represent the best global fits to a two-step binding model (24). Rate constants resulting from this analysis are: k45 = 1.8 ± 0.14 μM–1 s–1, k54 = 47 ± 4.3 s–1, k56 = 24 ± 1.7 s–1, k65 = 2.1 ± 0.3 s–1. (C) [mantADP]-dependence of the fast and slow phase raw amplitudes and total amplitude for mantADP binding pre-formed Gle1–Dbp5 complex. (D) [mantADP]-dependence of the fast and slow phase fractional amplitudes for mantADP binding pre-formed Gle1–Dbp5 complex. Continuous lines through the data in (C) and (D) are simulated amplitudes using rate constants from fits in B. We include the amplitude data to demonstrate consistency with a two-step binding model. Uncertainty bars represent standard error in the fits and are contained within the data points. InsP6 is included in all experiments at an equimolar concentration with Gle1.
