
Figure 5.
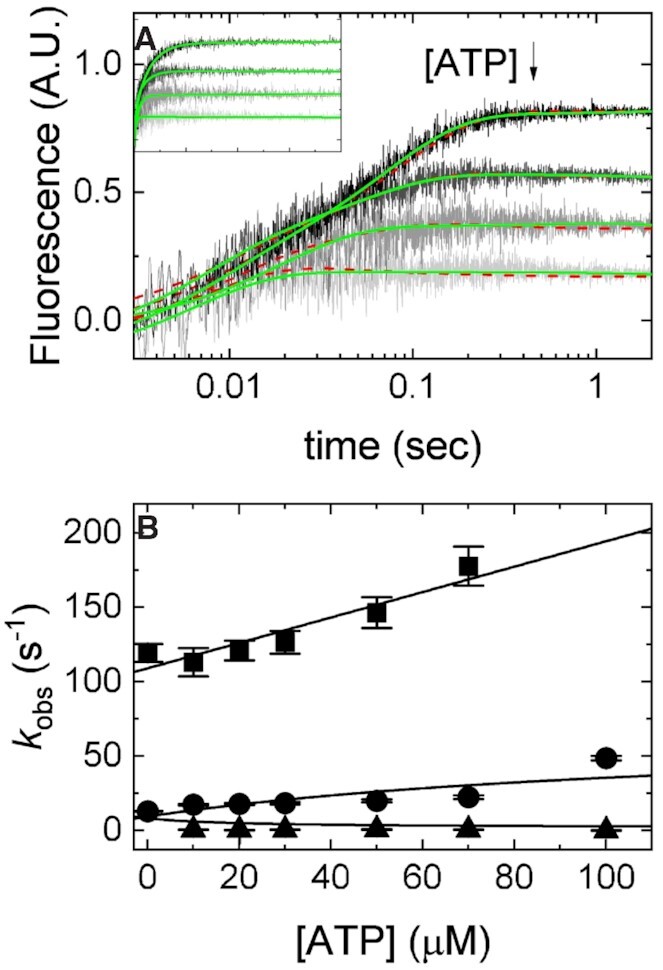
Kinetic competition between mantADP and ATP. (A) Time courses of FRET signal changes in pre-equilibrated solution of 2 μM Dbp5 (1 μM after mixing) with 20 μM Gle1 (10 μM after mixing) upon rapid mixing with an equal volume of 40 μM mantADP (20 μM after mixing) with various concentrations of ATP (from 0 to 300 μM after mixing). Continuous lines through the data are either the best fits to double or triple exponential functions (solid lines) or the best fits to a kinetic simulation of Scheme 2 (dashed lines). (B) [ATP]-dependence of the observed rate constants from exponential fits in (A) (solid lines) for mantADP binding pre-formed Gle1–Dbp5 complex. Continuous lines through the data are the best global fits to Supplemental Equations (S2.18), (S2.19) and (S2.24). Uncertainty bars represent standard error in the fits and are contained within the data points. For both fits, rate constants for mantADP binding were held to values determined from fits in Figure 4B. Fundamental rate constants resulting from the fits to a kinetic simulation of Scheme 2 are k47 = 0.2 ± 0.1 μM–1 s–1 and k74 = 4.1 ± 2.5 s–1, while fits to Equations S2.18, S2.19 and S2.24 yield k47 = 0.6 ± 0.1 μM–1 s–1 and k74 = 3.3 ± 1.1 s–1. InsP6 is included in all experiments at an equimolar concentration with Gle1.