Figure 1.
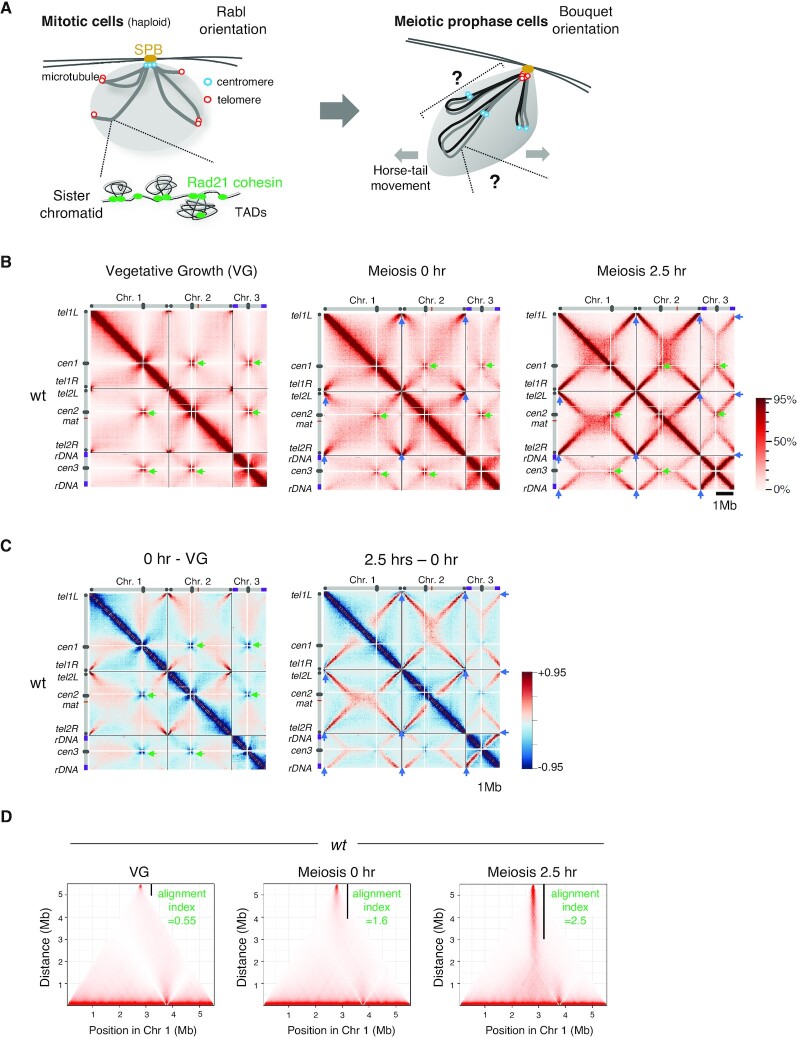
Hi-C analysis firmly recapitulates the structure of meiotic bouquet chromosomes. (A) Chromosome arrangement in mitosis and meiosis in Schizosaccharomyces pombe. In mitosis (left), centromeres are clustered at the spindle pole body (SPB) and display the Rabl orientation. The grey lines indicate sister chromatids. In meiotic prophase (right), grey and black lines indicate a homologous pair of chromosomes. Chromosomes are bundled by the telomeres clustered at the SPB, representing the bouquet orientation. (B) Hi-C contact maps at 20 kb resolution for three chromosomes prepared at vegetative growth (VG) and 0 and 2.5 h after entry into meiosis. Schematic views of each chromosome are shown on the top and the left. Green arrowheads represent the centromere clustering. Blue arrowheads in meiosis 0 and 2.5 h represent the telomere clustering as depicted by the left lower diagonal lines. The color scale on the right represents the percent ranking of contact scores. (C) Heat maps showing the difference of contacts detected by Hi-C. Left, subtraction of VG data from 0 h data. Right, subtraction of 0 h data from 2.5 h data. The color scale on the right represents the percent ranking of difference scores. (D) Degree of alignment of the two chromosome arms of telomere-bundled chromosome 1 is quantified as the alignment index (Supplementary Figure S1D) and is shown as the value along with a black vertical line in the Hi-C contact map.

