Figure 4.
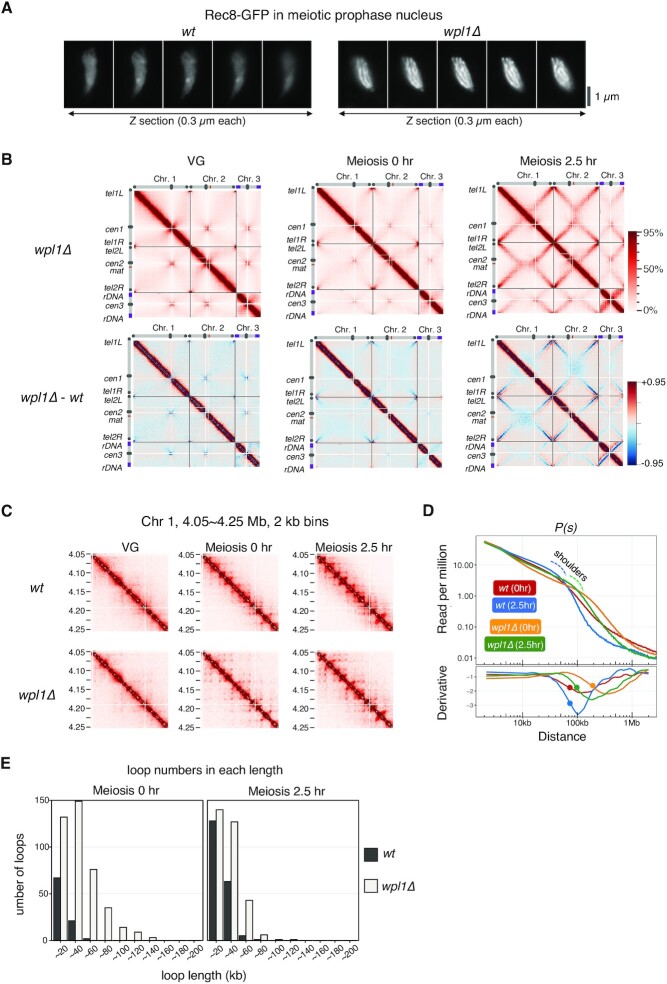
Wpl1 regulates chromatin loop length during meiotic prophase in S. pombe. (A) Serial Z sections (0.3 μm each) of Rec8-GFP signals at meiotic prophase in wild-type and wpl1Δ. Axis-like signals of Rec8 are clearly visible in wpl1Δ. (B) Upper panel displays Hi-C contact maps of three chromosomes at 20 kb resolution in wpl1Δ at vegetative growth (VG) and 0 and 2.5 h after entry into meiosis, with schematic views of each chromosome. The color scale on the right represents the percent ranking of contact scores. The lower panel displays heat maps showing the difference of contacts detected in each genome region by Hi-C in wild-type and wpl1Δ at VG and 0 and 2.5 h after entry into meiosis. The color scale on the right represents the percent ranking of difference scores. (C) Amplification of Hi-C contact maps showing the 200 kb region of chromosome 2 plotted at 2 kb resolution for the indicated strains at VG and 0 and 2.5 h after entry into meiosis. (D) Upper panel: P(s)s for meiosis 0 h and 2.5 h of wild-type (red and blue) and wpl1Δ (orange and green). The blue or green dotted line represents a shoulder of wild-type or wpl1Δ at 2.5 h after meiosis entry, respectively. Lower panel: The 1st-derivative of log-transformed Loess-smoothened curve is plotted. The filled circle indicates the transition point of the slope of P(s) obtained by 2nd-derivative. (E) Number of loops per length quantified using genome-wide loop caller HiCCUPS for wild-type (red, wt) and wpl1Δ cells (blue) at meiosis 0 h (left) and 2.5 h (right).

