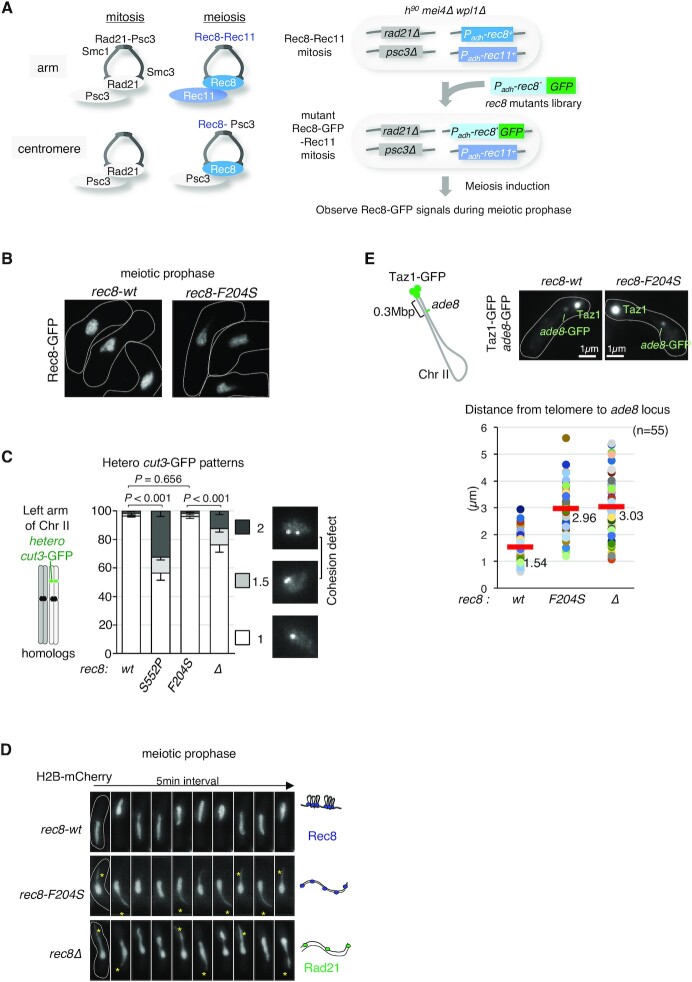
Figure 5.
Isolation of a rec8 mutant showing a defect in axis formation with an intact cohesion function. (A) The left panel shows a schematic view of cohesin complexes in fission yeast in mitosis and meiosis. In mitosis, the Rad21-Psc3 cohesin complex is ubiquitously located along the entire chromosome. In meiosis, the Rec8-Psc3 cohesin complex exists only at the centromeres, while the Rec8-Rec11 cohesin complex is present at the chromosomal arm regions. The right panel shows the scheme for isolation of rec8 mutants that specifically show defects in axis formation but display normal cohesion in meiotic prophase. The promoter of the rec8 gene is replaced by the adh1 promoter, and the promoter of the rec11 gene is replaced by the adh41 (a weaker version of adh1) promoter, to allow gene expression both in mitosis and meiosis. After transformation of a library of GFP-fused rec8 mutants with a selective marker, bsdR (not shown here), the blasticidin-resistant colonies obtained were subsequently induced to undergo meiosis to observe the axial Rec8-GFP signals. Growth rate of the blasticidin-resistant clone acts as an indicator of the functionality of Rec8-Rec11 cohesin. (B) Representative images of Rec8-GFP depicting cell shape (white dotted line) during meiotic prophase in wild-type and the isolated rec8-F204S mutant in this screening. (C) Cohesion defects in the chromosome arm region (cut3+ locus, left arm of chromosome 2) were examined in the indicated cells arrested at prophase I by the mei4Δ mutation. After fixation by methanol, the number of heterozygous cut3-GFP signals was counted (n > 150). A score of 2 or 1.5 cut3-GFP signals represents a complete or partial loss of sister chromatid cohesion, respectively. The rec8-S552P identified in this screening displays a remarkable defect in cohesion that is stronger than that of rec8Δ (see the text). Error bars show standard deviations from three independent experiment. P values were obtained from Chi-square test for statistical significance. (D) Time-lapse observations (5 min intervals) of horsetail nuclear movement in the indicated cells stained with histone H2B-mCherry. The cartoon on the right represents a model of the chromatin state for each strain. In rec8Δ, Rad21 partially compensates for the cohesion defect. (E) The upper left panel shows a schematic diagram of the distance of ade8-lacO inserts from the telomere of chromosome II. The upper right panels represent images of GFP signals for the indicated strains. Bright GFP signals at the edge of the nucleus represent telomeres (Taz1-GFP), and weak GFP signals represent the ade8 locus. The graph at the bottom displays a plot of the distance between the telomere and the ade8 locus in each cell during meiotic prophase for the indicated strains. The average distance is plotted (n = 55).

