
Figure 10.
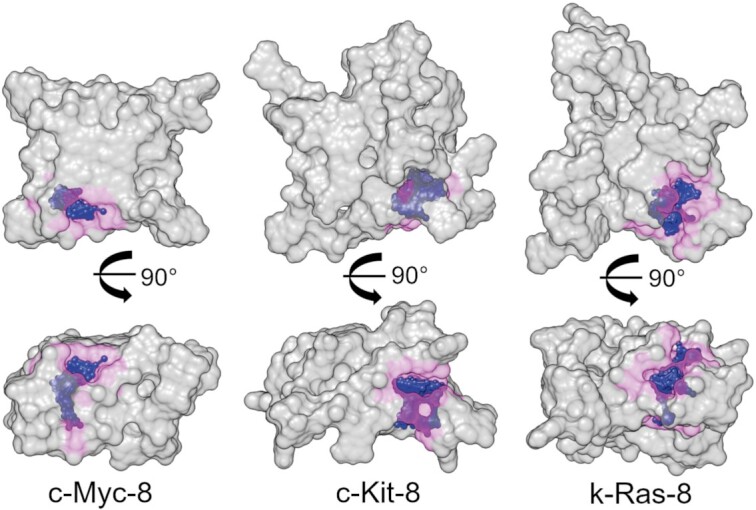
Space-filling representations of the c-Myc-8, c-Kit-8, and k-Ras-8 higher-order G-quadruplex models. The top row is looking down the central G4 stem and the bottom row is a side view. Magenta highlights a zone 4 Å from the ‘SITE’ ball and stick model (in blue) to emphasize the size of the predicted top-scoring binding sites.