Figure 2.

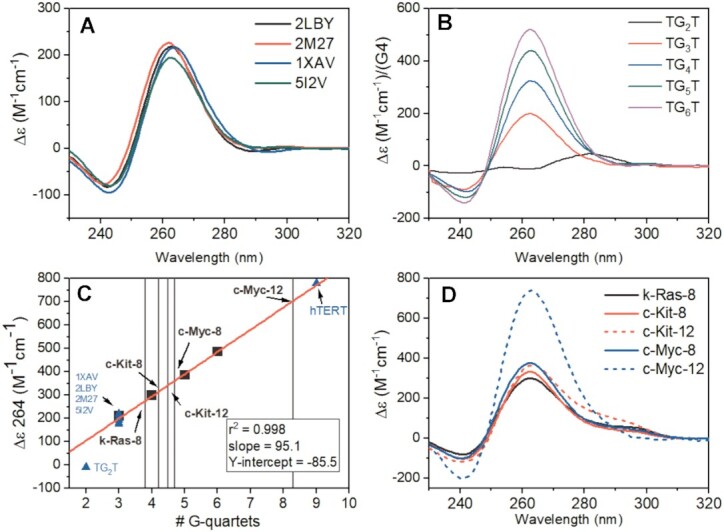
(A) CD spectra of parallel promoter G4s with three G-quartet stacks from the literature. (B) CD spectra of d[TGnT]4 oligos normalized to G4 concentration. (C) Linear relationship of the 264 nm CD signal normalized by G4 concentration of parallel d[TGnT]4 G4s (black squares) versus number of contiguous stacked G-quartets. The line of best fit is shown in red. The blue triangles show the 264 nm magnitudes for the promoter sequences in (A), the magnitude of the 9-quartet hTERT (52), and the TG2T sequence (which does not form a G4). The light gray vertical lines cross the regression at the 264 nm values obtained for the extended promoter 8-tract and 12-tract sequences (shown in D). (D) CD spectra of the 8-tract and 12-tract promoter sequences studied here.
