
Figure 5.
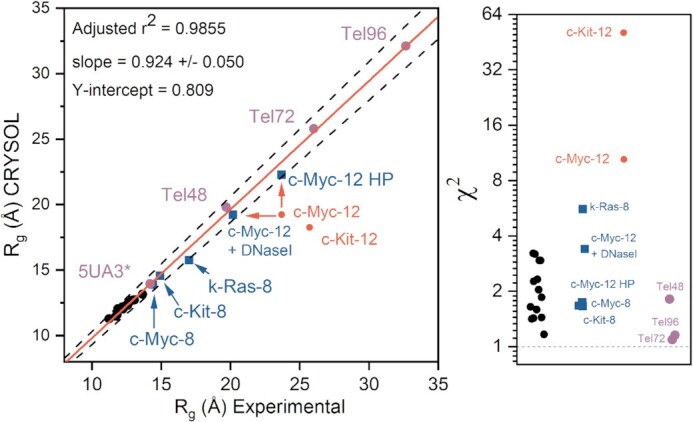
Correlation of experimental and CRYSOL calculated radii of gyration for known G4 structures (left) and corresponding χ2 values for each model (right). Black circles represent G4 structures that have been previously solved by either NMR (13/14) or X-ray (1/14) crystallography (tabulated values given in Supplementary Table S4 and CRYSOL fits in Fig. S22). Blue squares represent the G4 models derived from this study that are consistent with the collective experimental data. Red circles indicate parallel stacked models from this study that deviate from one or more biophysical measurements (initially). The red arrows indicate changes in correlation of c-Myc-12 either with DNaseI treatment or by modeling in competing hairpins. Purple circles are values obtained from prior G4 SAXS studies (81,112). In the case of the telomere sequences (Tel48, 72 and 96) the regression values were obtained from EOM analyses (118). The dashed black lines indicate a ± 5% of the line of best fit.