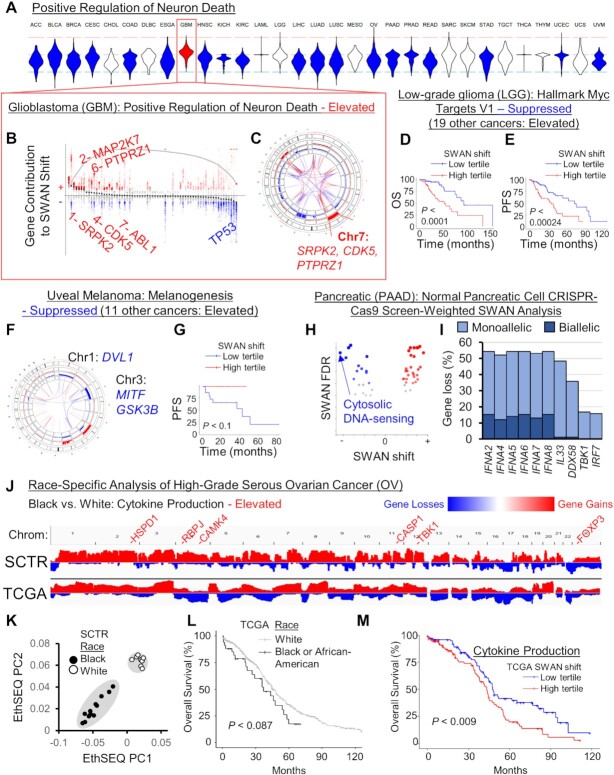
Figure 5.
Cancer-specific CNA patterns. (A) Rare pathways had opposite SWAN shifts relative to the majority of cancer types. Shown is the example of ‘GO: Positive regulation of neuron death’ which was uniquely upregulated in the brain cancer GBM, as illustrated in a (B) SWAN feather plot and (C) Circos plot. (D) Overall survival (OS), P is from Kaplan–Meier analysis. (E) Progression-free survival (PFS) plot. (F) SWAN Circos plot. (G) Progression-free survival (PFS) plot. (H) SWAN analysis scored by HPNE CRISPR-proliferation screen hits in place of haploinsufficiency. The most suppressed pathway by magnitude is highlighted. (I) The most frequently deleted genes from (H) pathway. (J) Integrative Genomics Viewer cohort summary plots for the new African-American enriched OV cohort (SCTR) compared to The Cancer Genome Atlas (TCGA) OV cohort. Noted genes indicate SWAN prioritized genes within indicated pathway. (K) EthSEQ analysis and principal component clustering of variants in the SCTR cohort. Self-identified race is labeled for black and white patients. (L) Kaplan–Meier analysis of TCGA tumors separated by self-identified race and plotted for overall survival. (M) Kaplan–Meier plot of TCGA data separated by SWAN shifts.

