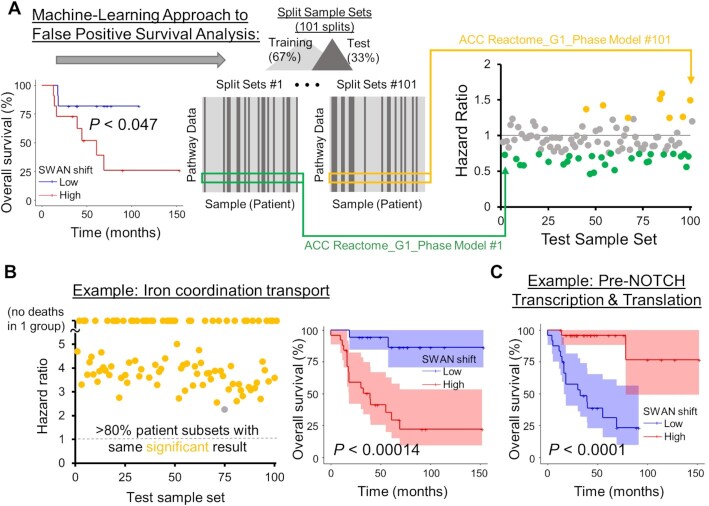
Figure 7.
Machine-learning approach for improved prognostic estimates of CNA influenced pathways. (A) An example of a nominally-significant prognostic pathway, corrected by a machine learning approach. Patient data are first separated by SWAN pathway shifts, with the ‘low’ and ‘high’ groups separated by 1 SD centered at the median shift. With the entire patient cohort considered, a Kaplan–Meier analysis yields P < 0.047. 101 training sets of SWAN shift data build risk scores, then the upper quartile risk is compared to the lower quartile risk group by Kaplan–Meier analysis to yield a P-value for the test group. Colored circles indicate HR at least 1 SD from the null 1 value. Potential false positive prognostic pathways were removed by (1) determining significance in the applied CoxPH model risk for each test set, and (2) determining CoxPH HR direction in each training set. The most prognostic pathways are labeled as those with >80% of randomizations as both significant and in same HR direction, such as in example (B). A Kaplan–Meier overall survival curve with 95% confidence interval is shown for the whole patient cohort (right panel). (C) A negatively prognostic Kaplan–Meier overall survival curve with 95% confidence interval is shown. In this case, 98% of patient picks were significant.

