Figure 5.
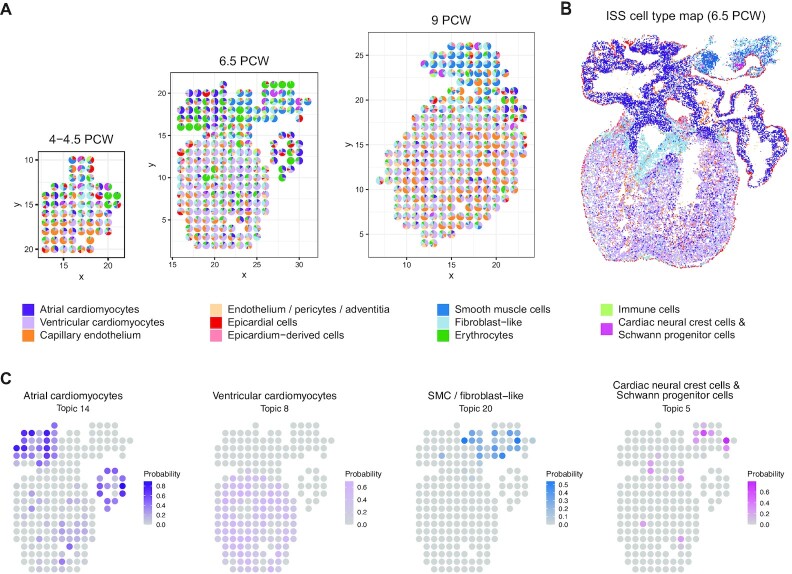
Application of STRIDE on the developing human heart. (A) The deconvolution result of sample 3, 9 and 16 from 4.5–5 PCW, 6.5 PCW and 9 PCW, respectively. Each scatter represents a spot in the ST slide. The pie chart is used to reflect the proportions of different cell types within each spot. Colors represent different cell types. (B) The spatial cell-type map created through the integration of ISS and scRNA-seq by the original study. (C) The distribution of topics associated with atrial and ventricular cardiomyocytes, SMC or fibroblast-like cells, and cardiac neural crest cells & Schwann progenitor cells. The colors represent the probability of topics in each spot.

