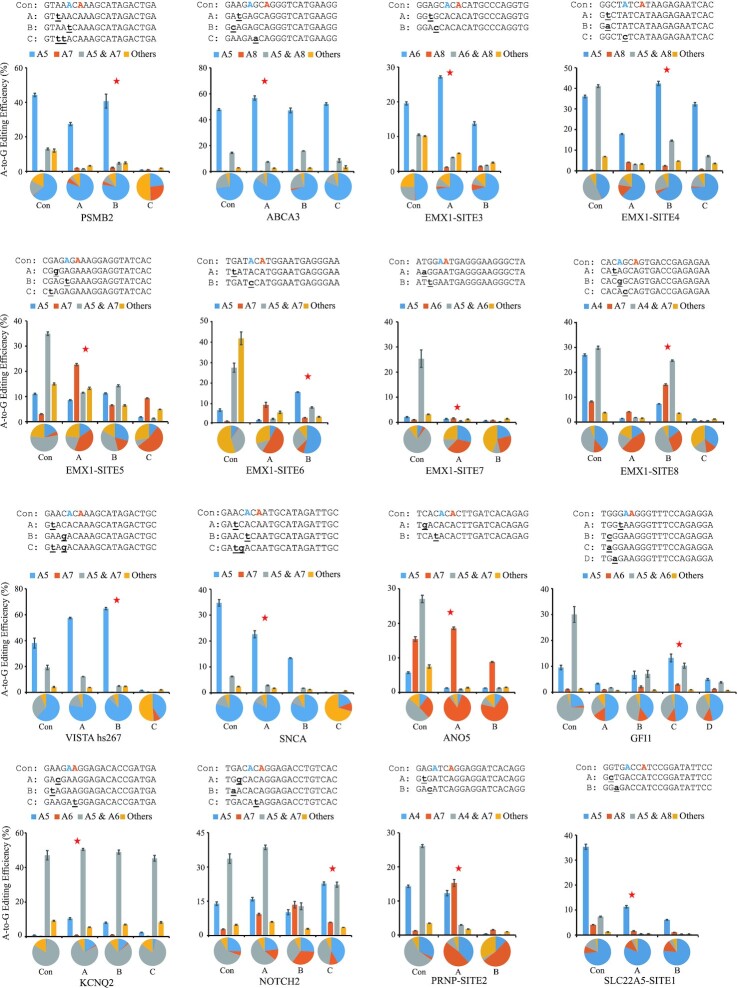
Figure 2.
Editing efficiencies and editing product fractions of adenine base editing with igRNA in HEK293T cells. Base editing efficiencies and fractions of editing products obtained from 16 loci by the NG-ABEmax editor using gRNAs and igRNAs. Con, the control gRNAs that exactly matched the target sequence. Capital A to D, different igRNAs. The red asterisk represents the igRNA with the best performance. The bars represent mean values, and the error bars represent the s.d. of three independent biological replicates. The pie charts represent the fractions of various types of editing products.

