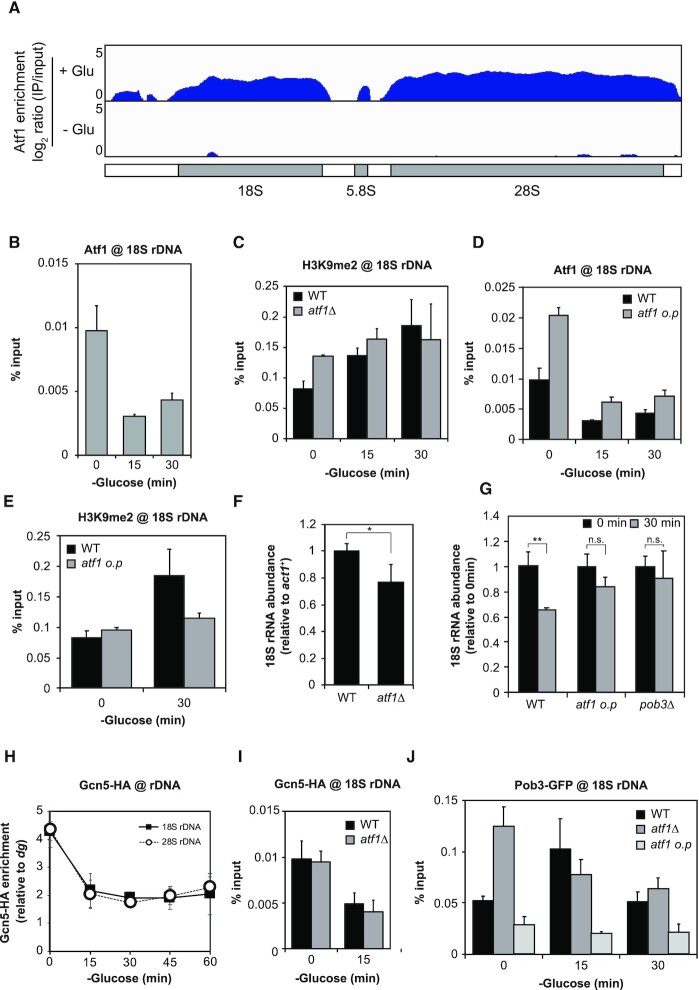
Figure 2.
Dissociation of Atf1 from rDNA and accumulation of FACT for promotion of H3K9 methylation. (A) ChIP-seq data showing Atf1 enrichment in rDNA during glucose-rich (+Glu, 0 min, upper) and glucose-poor (–Glu, 15 min, lower) conditions. The schematic diagram below the plots indicates the annotated rDNA region. The y-axis exhibits log2 ratio of IP/input (0–5). (B) ChIP-qPCR results quantifying Atf1 occupancy in 18S rDNA during the early course of glucose starvation (mean + SEM: n = 3). (C) H3K9me2 levels in 18S rDNA upon glucose starvation in the wild type (WT) and atf1Δ strains (mean + SEM: n = 3). (D) ChIP-qPCR quantifying Atf1 occupancy in 18S rDNA in the wild type (WT) and the strain overexpressing Atf1 (atf1 o.p) (mean + SEM: n = 3). The wild type control data is the same as in (B). (E) H3K9me2 levels in 18S rDNA under glucose-rich (0 min) and low glucose (30 min) conditions in the wild type (WT) and atf1 o.p strains (mean + SEM: n = 3). The wild type data is identical to that in (C). (F and G) 18S rRNA abundance relative to act1+ mRNA in the wild type (WT) and atf1Δ strains under glucose-rich condition (F) and in the wild type (WT), atf1 overexpression strain (atf1 o.p) and pob3Δ strains during glucose starvation (G). Student's t-test (two-tailed) was applied and statistical significance was indicated (*P < 0.05, **P < 0.01, n.s., not significant), (mean + SD, n = 3). (H) ChIP-qPCR showing the localization of Gcn5-HA in 18S (filled squares) and 28S rDNA (open circles) after glucose starvation. The % input of Gcn5-HA was normalized to the % input of the dg region (mean ± SEM: n = 4). (I) Enrichment of Gcn5–HA in 18S rDNA in the wild type (WT) and atf1Δ strains (mean + SEM: n = 3). (J) Binding of Pob3-GFP to 18S rDNA in the wild type (WT), atf1Δ and atf1 o.p strains. Times after glucose depletion are indicated below the graph (mean + SEM: n = 3).

