
Figure 3.
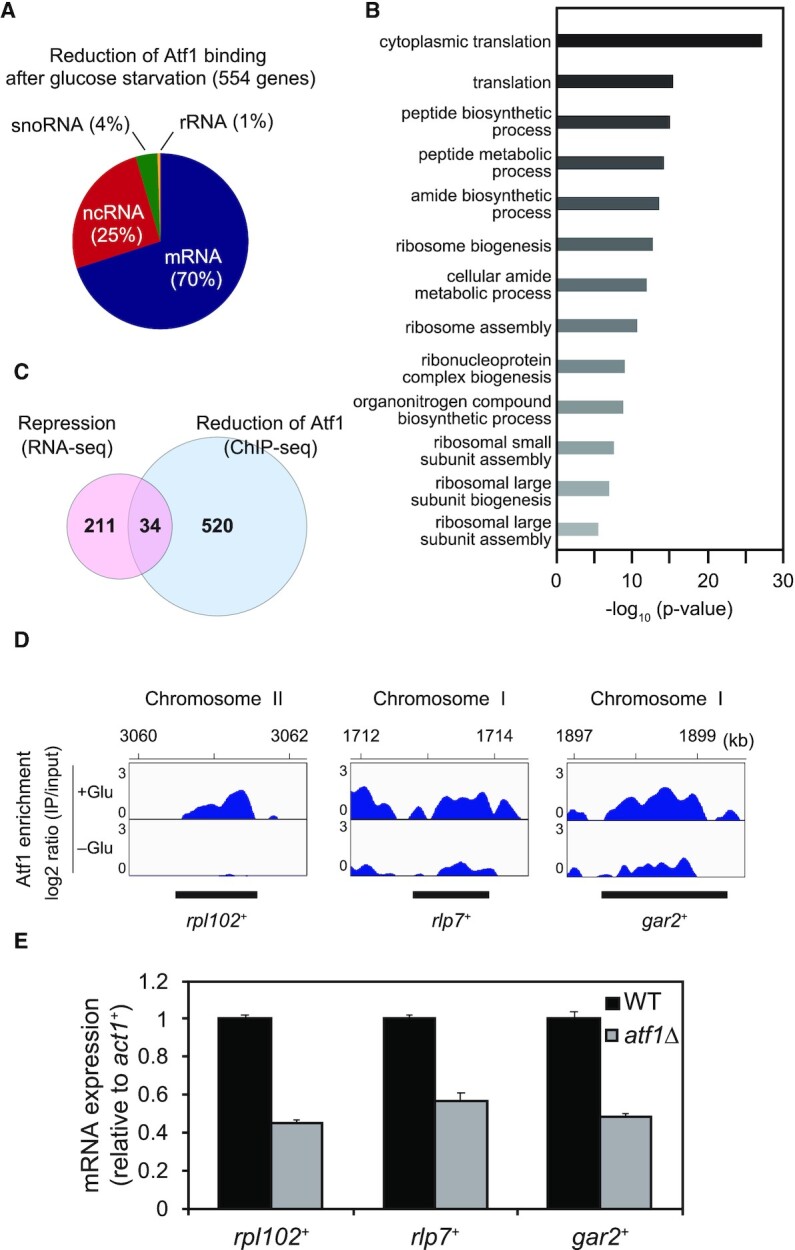
Genome-wide correlation between Atf1-dissociation sites and transcriptional silencing of ribosome-related genes during glucose starvation. (A) A pie chart showing the proportion of gene types marked by glucose starvation-induced Atf1 dissociation. The percentage of mRNA, ncRNA, snoRNA, and rRNA in 554 genes are shown in parentheses. (B) Graph showing the enrichment of each gene ontology (GO) term. The GO terms were identified using Generic Gene Ontology Term Finder. The p-value cutoff was set to 0.01. (C) Venn-diagram showing the number of genes overlapping between repressed transcripts and genes exhibiting Atf1 dissociation. (D) ChIP-seq data of Atf1 for representative loci in the overlapped region shown in (C). ‘+Glu’ and ‘–Glu’ represent data at 0min and 15 min of glucose depletion. The y-axis exhibits log2 ratio of IP/input (0–3). The numbers at the top indicate coordinates on the corresponding chromosomes (kb) and the bottom black lines indicate positions of gene regions. (E) mRNA expression levels of rpl102+, rlp7+ and gar2+ relative to that of the act1+ gene in the wild type (WT) and atf1Δ cells (mean + SD: n = 3).