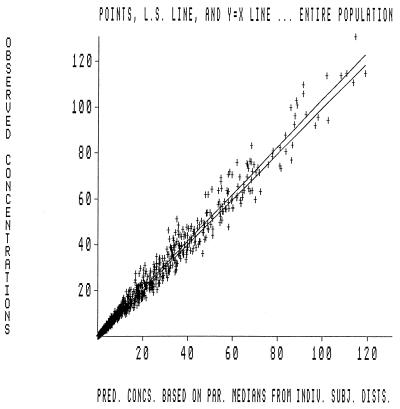
FIG. 3.
Plot of predicted versus observed concentrations for 52 patients contributing 1,689 plasma samples for which evernimicin concentrations were determined. The r2 value was 0.966; P was ≪0.0001. The values on the x axis indicate the predicted concentrations based on the parameter medians for the distribution of individual subjects. The figure shows the individual datum points, l.s. line, and the y equal to x line for the entire population.

