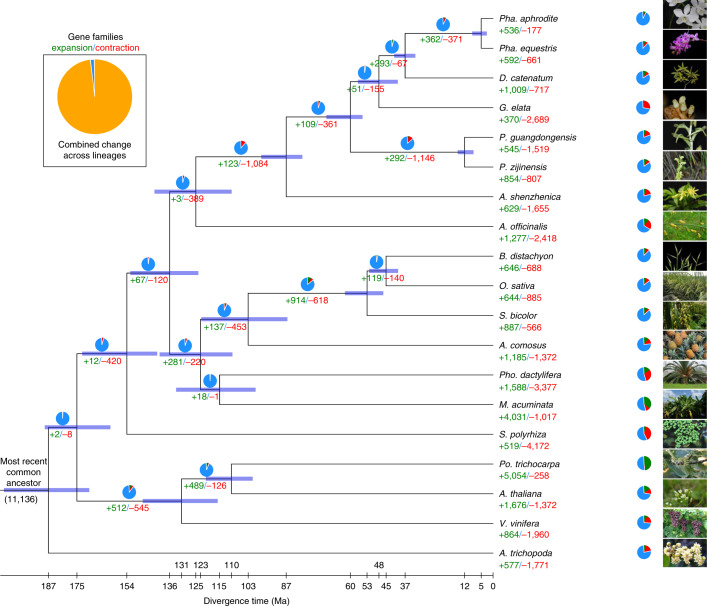
Fig. 2. Phylogenetic tree showing divergence times and the evolution of gene-family sizes.
Phylogenetic tree showing the topology and divergence times for 19 plant species. Divergence times are indicated by light blue bars at the internodes. The range of the light blue bars indicates the 95% highest posterior density of the divergence time. Numbers in green and red at branches indicate the expansion and contraction of gene families, respectively. The pie chart colours represent the changes of gene family (blue, no significant change; orange, expanded or contracted; green, expanded; red, contracted); each colour sector illustrates the proportion of each type of gene-family change. We set different birth and death rates for different branches (Poaceae, Orchidaceae, other monocots and the other branches) and used the likelihood ratio test to select the optimized sets of rates (Methods).

