
Extended Data Fig. 1. The orthologous Ks distributions.
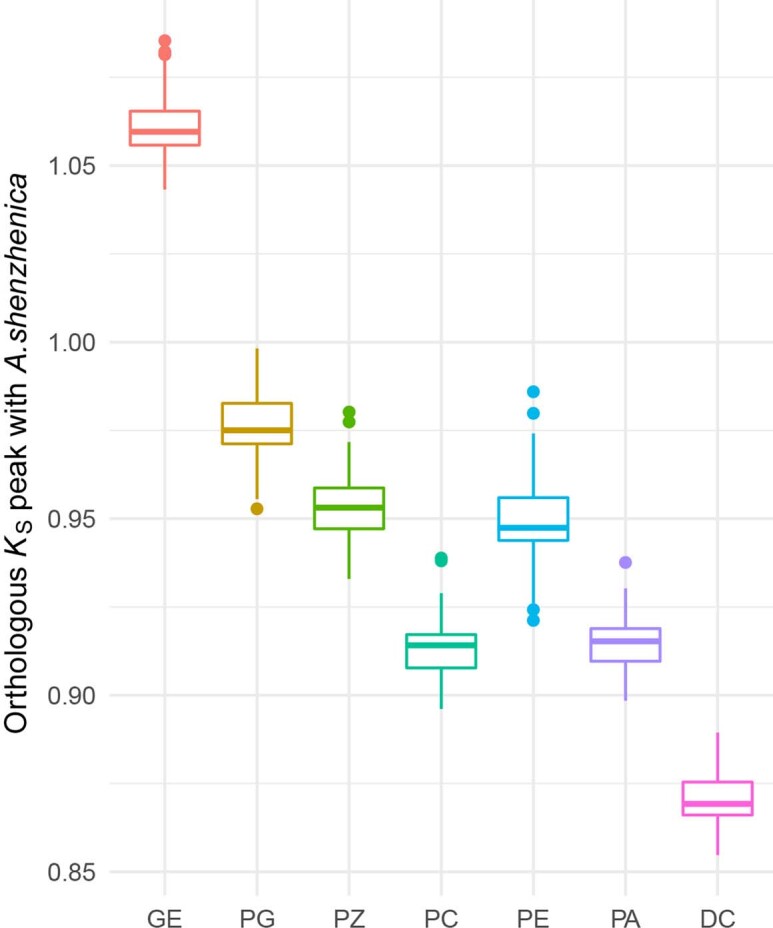
Modes of the one-to-one orthologous Ks distributions between A. shenzhenica and each of G. elata (GE), P. guangdongensis (PG), P. zijinensis (PZ), P. clavellate (PC), Pha. equestris (PE), Pha. aphrodite (PA), and D. catenatum (DC) by resampling the corresponding Ks distributions 200 times. The line in the middle of a box represents the median value and the up and bottom borders of the boxes denote the 75th and 25th percentiles, respectively. The upper and lower bars show the largest value within 1.5 times interquartile range above 75th percentile and the smallest value within 1.5 times interquartile range below 25th percentile, respectively. A dot shows outside value, which is > 1.5 times and < 3 times the interquartile range beyond either end of the box.