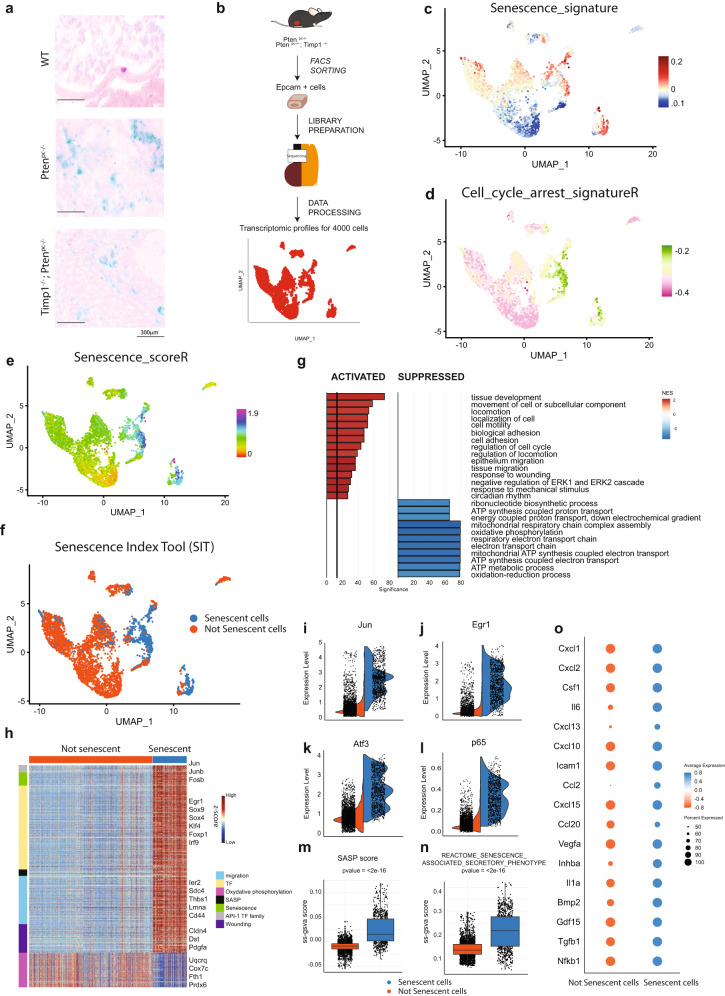
Fig. 1. Overview of the identification of senescent cells in prostate cancer.
a Representative images of SA-β-Gal in WT, Ptenpc−/− and Ptenpc−/−; Timp1−/− genotypes (Scale bar 300 μm). Data are representative of two independent experiments. b Schematic representation of single cells isolation and sequencing (n = 4 mice). c UMAP plot of cancer epithelial cells colored by Senescence_signature. d UMAP plot of cancer epithelial cells colored by Cell_cycle_arrest_signatureR. e UMAP plot of cancer epithelial cells colored by Senescence_scoreR. f UMAP plot of cancer epithelial cells showing senescent cells (blue) and not senescent cells (orange) found through SIT. g Bar plot showing enrichment pathway analysis of senescent cells compared to not senescent cells. gseGO function results: Weighted Kolmogorov Smirnov (WKS) test followed by FDR correction. h Heatmap of differentially expressed genes between senescent and not senescent cells. Row annotation showing the functions of different genes (migration, SASP, wounding, TF). Wilcoxon Rank Sum test followed by FDR correction. i Violin plot of the most upregulated gene in senescent cells: Jun. j, k Violin plot of key transcription factors involved in senescence transcriptional program: Egr1, and Atf3. l Violin plot showing expression of p65/RelA in senescent cells. m Boxplot showing the SASP score of senescent and not senescent cells (two sided Wilcox-test: p value < 2.2e−16; N = 3992 cells, Not senescent cells (left) minimum = −0.0537, lower-quartile = −0.0146, median = −0.0088, upper-quartile = −0.0039, maximum = 0.0408, Senescent cells (right) minimum = −0.0353, lower-quartile = 0.0018, median = 0.0154, upper-quartile = 0.0466, maximum = 0.1172). n Boxplot showing ss-gsva score of published gene set of Reactome collection77 (senescence_associated_secretory_phenotype) in senescent and not senescent cells (two sided Wilcox-test: p value < 2.2e−16; N = 3992 cells, Not senescent cells (left) minimum = 0.0634, lower-quartile = 0.1183, median = 0.1363, upper-quartile = 0.1607, maximum = 0.2952, Senescent cells (right) minimum = 0.0527, lower-quartile = 0.1527, median = 0.2183, upper-quartile = 0.2768, maximum = 0.4215). o Expression of fundamental SASP genes where dot size and color represent the percentage of cell expressing and the averaged scaled expression value, respectively. Source data are provided as a Source Data file.

