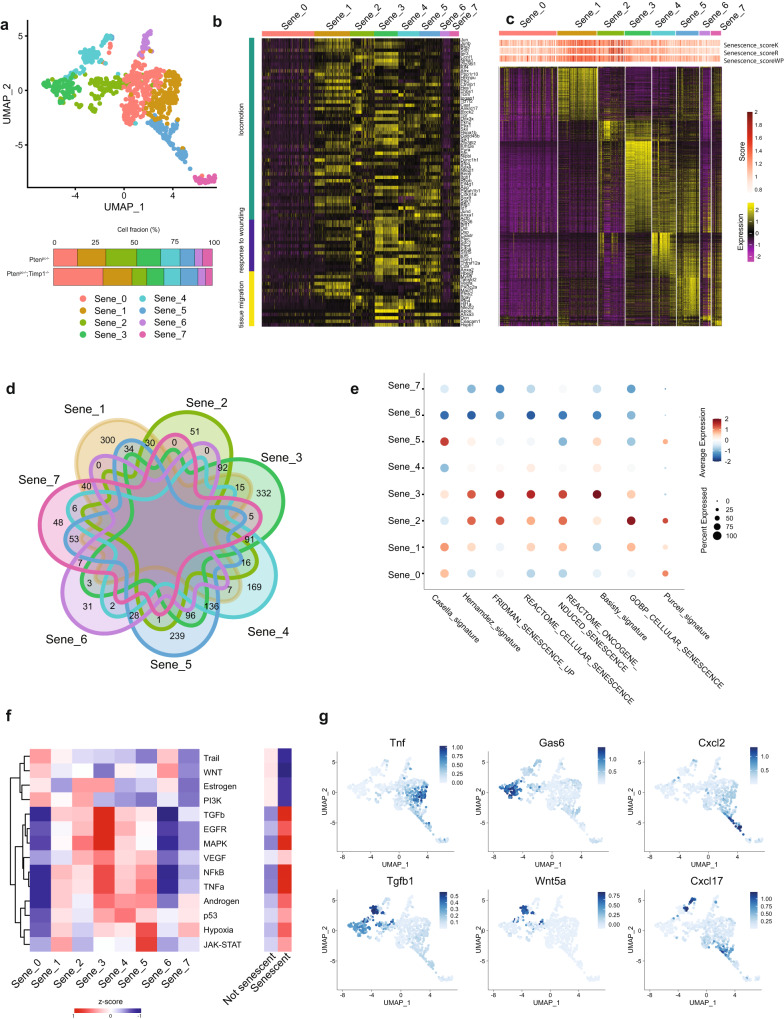
Fig. 2. Senescent cells are a heterogeneous population.
a UMAP view of only senescent cells, colored by clusters found with FindCluster function (res = 0.5) (top) and percentage of clusters in the two genotypes (bottom). b Heatmap showing expression of differentially expressed genes found in total senescent cells related to pathways activated in total senescent cells. c Heatmap showing differentially expressed genes between various senescent clusters (Sene_clusters) using FindAllMarker function. Wilcoxon Rank Sum test followed by FDR correction. d Venn diagrams showing the differentially expressed genes in each Sene_cluster. Overlapping areas indicate the number of genes commonly modulated among subpopulations. The numbers report only unique differentially expressed genes or transcripts common between two clusters. e Dotplot showing ssGSEA of previously published senescence signature (Casella_signature31, Hernandez_signature32, Fridman_senescence_up33, Basisty_signature34, Purcell_signature35, Cellular senescence from Gene Ontology collection, Oncogene-induced senescence and Cellular senescence gene sets from Reactome collection) in all the senescent clusters. f Heatmap showing pathway activity of 14 relevant signaling pathways calculated using PROGENy80 between different senescent subpopulations (left) and between senescent and not senescent cells (right). g FeaturePlot showing expression levels of different secreted factors upregulated in specific Sene_clusters and not expressed in the other senescent cells. Source data are provided as a Source Data file.

