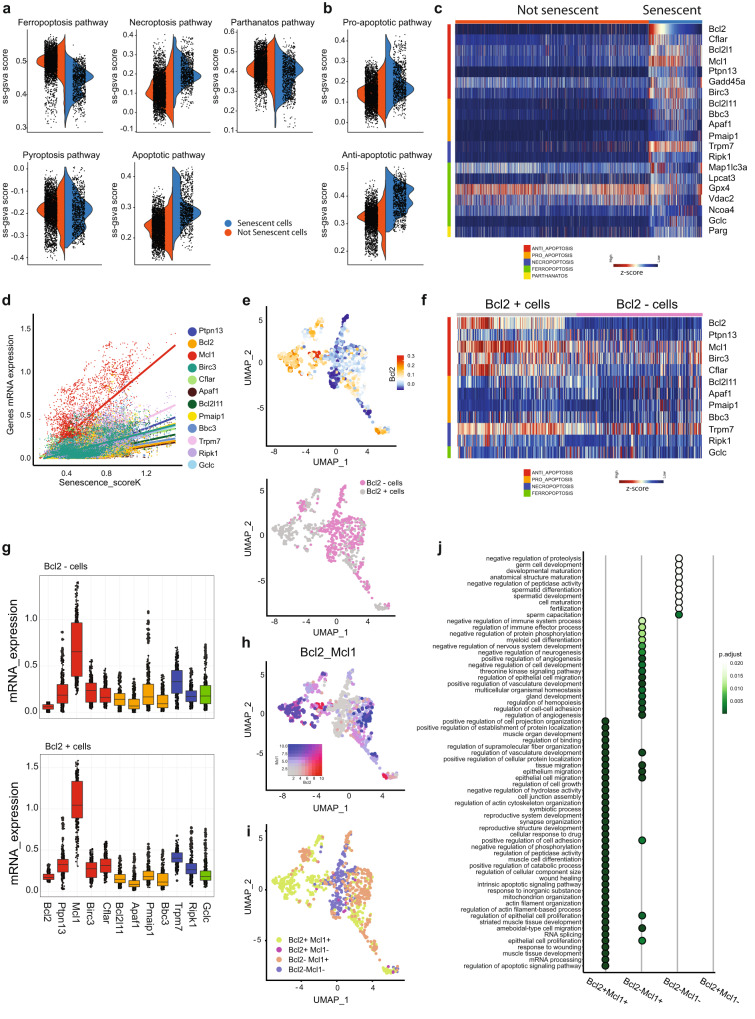
Fig. 3. Survival mechanisms of senescent cells.
a Violin plot showing ss-GSVA score activation of different cell death modalities between senescent and not senescent cells. b Violin plot showing ss-GSVA score activation of apoptosis between senescent and not senescent cells, separating in pro and anti-apoptotic genes. c Heatmap of 20 differentially expressed genes of different cell death modalities. FDR < 0.05. d Correlation plot between Senescence_scoreK and survival related-genes with Pearson correlation coefficient higher than 0.4 and FDR < 0.05. e UMAP plot showing Bcl2 expression levels in senescent cells (top) and classification of them in Bcl2+ or Bcl2- (bottom). f Heatmap showing z-score expression levels of 12 survival related-genes, positively correlated with Senescence_scoreK,WP,R, in Bcl2+ and Bcl2- senescent cells. g mRNA expression levels of 12 survival related-genes in Bcl2+ and Bcl2- senescent cells (N = 862 cells, Bcl2 - cells: Bcl2 median = 0.0596; Ptpn13 median = 0.1857; Mcl1 median = 0.654; Birc3 median = 0.234; Cflar median = 0.160; Bcl2l11 median = 0.140; Apaf1 median = 0.068; Pmaip1 median = 0.165; Bbc3 median = 0.091; Trpm7 median = 0.331; Ripk1 median = 0.169; Gclc median = 0.175. Bcl2 + cells: Bcl2 median = 0.169; Ptpn13 median = 0.324; Mcl1 median = 1.045; Birc3 median = 0.274; median = 0.314; Bcl2l11 median = 0.145; Apaf1 median = 0.083; median = 0.178; Bbc3 median = 0.113; Trpm7 median = 0.402; Ripk1 median = 0.261; Gclc median = 0.179). h Co-expression of Bcl2 and Mcl1 in senescent cells. i UMAP plot showing the classification of senescent cells based on Bcl2 and Mcl1 expression levels. j Dotplot showing over-representation results of biological process (GO) pathway analysis by considering senescent cell subclassification. Hypergeometric test followed by FDR correction. Source data are provided as a Source Data file.

