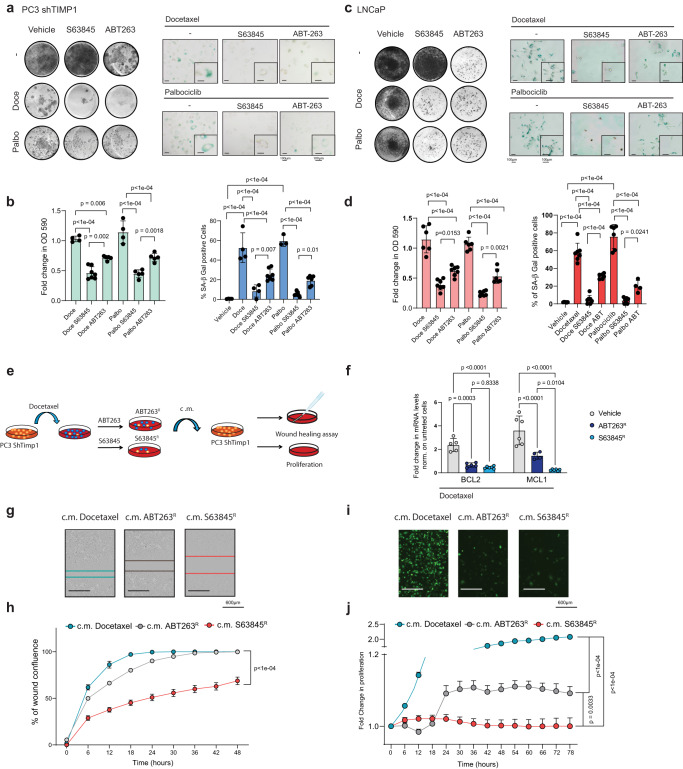
Fig. 4. Mcl-1 targeting as senolytic anti-migratory therapy.
a Representative pictures of crystal violet and SA-β Gal of PC3 shTIMP1 treated cells (Scale bar 100 μm). Data are representative of three independent experiments. b Cristal violet and SA-β Gal quantification (Cristal violet n = 4 for Docetaxel and Palbociclib, n = 5 for Docetaxel ABT263, Palbociclib S63845 and Palbociclib ABT263, n = 7 for Docetaxel S63846; SA-β Gal n = 4 for Vehicle, Docetaxel, Docetaxel S63845, n = 3 for Palbociclib, n = 6 for Palbociclib ABT263 and n = 7 for Docetaxel ABT263 and Palbociclib S63845, n = biological independent samples from three independent experiments). c Representative pictures of crystal violet and SA-β Gal of LNCaP treated cells (Scale bar 100 μm). Data are representative of three independent experiments. d Quantification of crystal violet and SA-β Gal staining (Cristal violet n = 6 for Docetaxel, Palbociclib and Palbociclib ABT263, n = 7 for Docetaxel S63845, Docetaxel ABT263 and Palbociclib S63845; n = biological independent samples, SA-β-Gal n = 6 for Vehicle, Docetaxel ABT263 and Palbociclib, n = 7 for Docetaxel, Docetaxel ABT263 and Palbociclib S63845, n = 4 for Palbociclib ABT263, n = biological independent samples from three independent experiments). e Schematic representation of the experimental design. f RT-qPCR analysis of Docetaxel treated cells and the remaining clones upon ABT263 (ABT263R) and S63845 (S63845R) treatment (for Bcl2 n = 5 for Vehicle and ABT263R, n = 6 for S63845R; for Mcl1 n = 6 for Vehicle and S63845R and n = 4 for ABT263R, n = biological independent samples from three experiments). The p values were determined by one way ANOVA followed by Tukey’s multiple comparison test. g Representative pictures of wound healing assay (Scale bar 600 μm). Data are representative of two independent experiments. h Percentage of wound confluence over time normalized to time 0 (for c.m. Docetaxel and c.m. ABT263R n = 8, for c.m. S63845R n = 6, n = biological independent samples from two independent experiments). i Representative pictures of proliferation assay (Scale bar 600 μm). Data are representative of two independent experiments. j Fold change in proliferation normalized to time 0 (for c.m. Docetaxel, c.m. ABT263R and c.m. S63845R n = 6, n = biological independent samples from two independent experiments). b, d, h, j The p values were determined by one way ANOVA followed by Tukey’s multiple comparison test. The whole Anova results were given in the Supplementary Data 4. b, d, f Data are represented as mean ± SD. h, j Data are represented as mean ± SEM. Source data are provided as a Source Data file.

