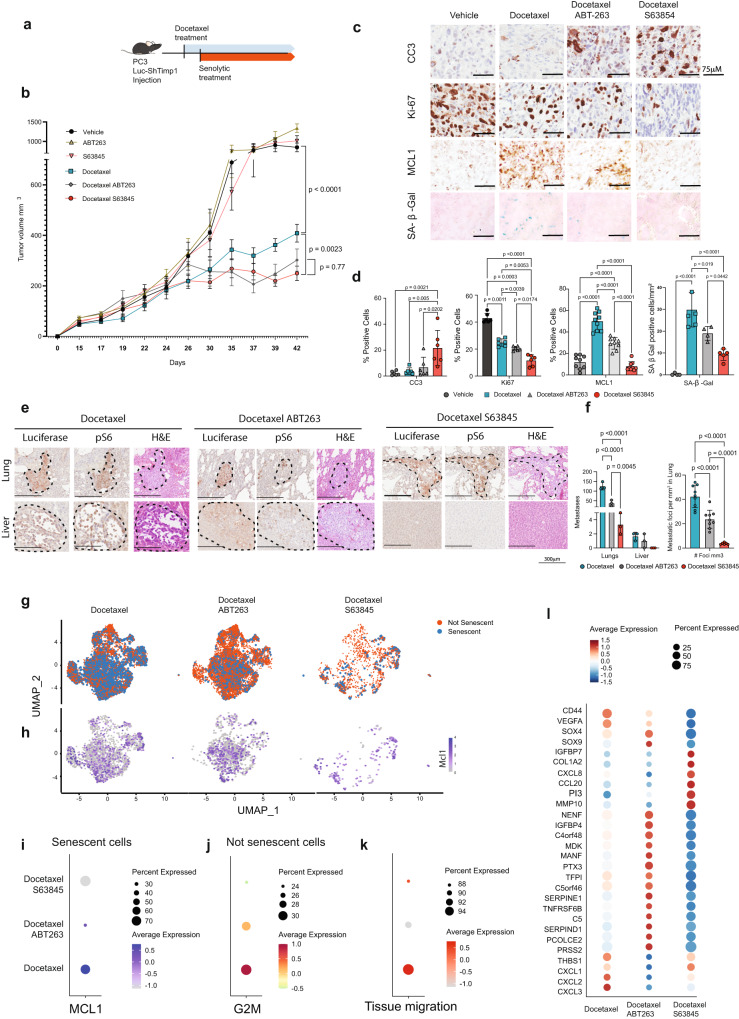
Fig. 5. S63845 is an efficient senolytic therapy in vivo.
a Schematic representation of the experimental design. b Growth curve of tumors in vivo in mm3 (n = 5 for Untreated, ABT263, S63845, Docetaxel, Docetaxel + ABT263, Docetaxel + S63845, n = independent animals from one experiment). The p values were determined by two-way ANOVA followed by Tukey’s multiple comparison test at time point 39 days post injection, separately for single treatment (Untreated, Docetaxel, ABT263, S63845) and Docetaxel treated groups (Docetaxel, Docetaxel + ABT263, Docetaxel + S63845). Data are represented as mean ± SEM. c Representative pictures of immunohistochemistry for Cleaved Caspase 3 (CC3), Ki67, MCL-1 and SA-β Gal. Data are representative of one experiment. d From left, quantification in percentage (CC3 n = 6, Ki67 n = 6, MCL-1 n = 9 and SA-β Gal n = 6; n = multiple areas of four animals from one experiment. The p values were determined by One-way ANOVA test followed by Tukey’s multiple comparisons test). Data are represented as mean ± SD. e H&E, Luciferase and phospho-S6 immunohistochemical staining in lung and liver metastases in Docetaxel, Docetaxel + ABT263 and Docetaxel + S63845 treated NRG mice. Data are representative of one experiment. f Bar graph representing metastases quantification (n = 9 for Docetaxel and Docetaxel ABT263, n = 6 for Docetaxel S63845; = multiple areas of 4 animals from one experiment). For metastases count the p values were determined by Two-way ANOVA followed by Šídák’s multiple comparisons, while for the count of metastases foci per mm3, the p values were determined by one Way ANOVA followed by Tukey’s multiple comparisons test. Data are represented as mean ± SD g UMAP plot of senescent and not senescent cells, defining using SIT, in xenograft PC3 shTIMP1 cells treated with Docetaxel alone or in combination with ABT263 or S63845 (Docetaxel % senescent cells = 35.5%, Docetaxel + ABT263 % senescent cells = 15.6%, Docetaxel + S63845 % senescent cells = 14%). h UMAP plot of senescent cells showing MCL-1 expression in xenograft PC3 shTIMP1 cells treated with Docetaxel alone or in combination with ABT263 or S63845. i MCL-1 expression for each treatment, where dot size and color represent the percentage of cells expressing the indicated gene and the average scaled expression value, respectively. j G2M signature for each treatment, where dot size and color represent percentage of cells expressing and the averaged scaled expression value, respectively. k ss-GSVA of tissue migration signature for each treatment, where dot size and color represent percentage of cell expressing and the averaged scaled expression value, respectively. l Marker genes expressions for each treatment, where dot size and color represent percentage of cell expressing and the average scaled expression value, respectively. Source data are provided as a Source Data file. The whole Anova results were given in the Supplementary Data 4.

