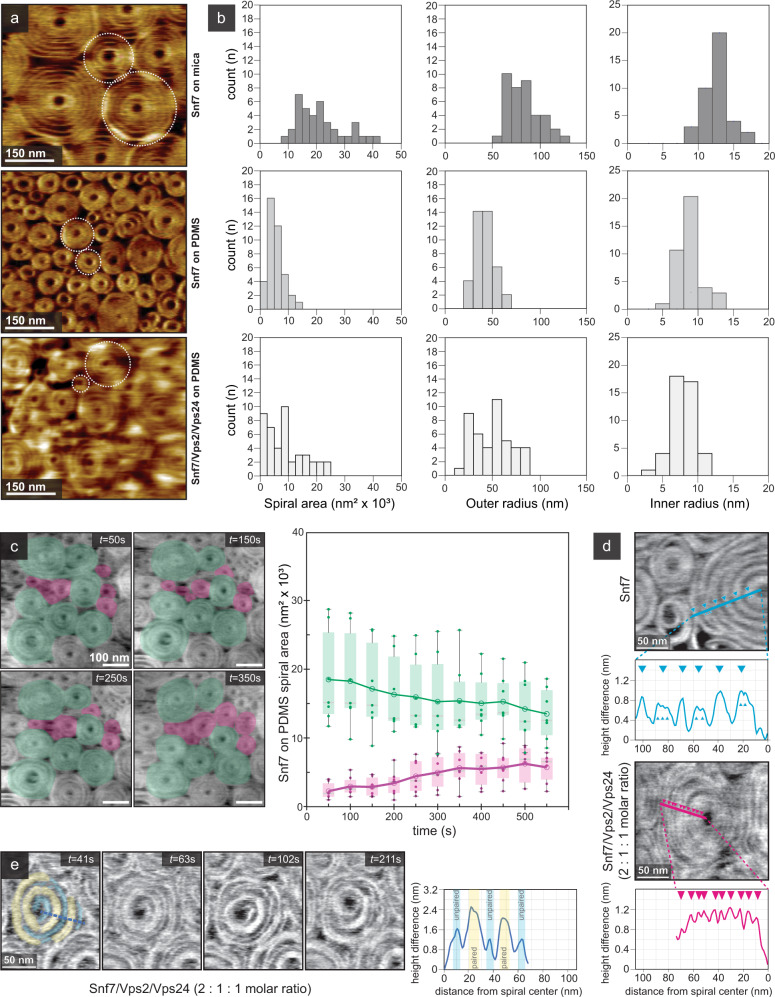
Fig. 7. Snf7 spiral dynamics on SLBs on a soft substrate.
a HS-AFM image of Snf7 spirals on mica (top), on PDMS (middle) and on PDMS after addition of Vps2/Vps24 to pre-polymerized Snf7 spirals (bottom). b Area (left), outer radius (center) and inner radius (right) distributions of Snf7 spirals on mica (top), on PDMS (middle) and on PDMS after addition of Vps2/Vps24 to pre-polymerized Snf7 spirals (bottom). c Left: HS-AFM time-lapse images of Snf7 spirals on PDMS-SLB (top right corner: time after Snf7-addition; overlays: spirals formed during initial polymerization (green, n = 7) and newly formed spirals (magenta, n = 7)(Supplementary Movie 11). Right: Box plot of Snf7 spiral area over time. Individual spiral areas are plotted as dots. Shaded boxes indicate 2nd and 3rd quartile. The whiskers of each boxplot extend to the most extreme data points. Empty circles connected by lines are the mean of each group; median of each group is represented by faint gray lines. d Top: Snf7 spiral on PDMS-SLB with line profile (cyan) showing height of spiral turns. Large cyan triangles show centers of turns, small cyan triangles point towards minor peaks within turns, corresponding to individual strands. Bottom: Spiral on PDMS-SLB after Vps2/Vps24 addition to pre-polymerized Snf7 spirals with line profile (magenta) showing height of individual spiral turns. Magenta triangles point towards individual filament peaks. e Left: Time lapse of individual spiral after addition of Vps2/Vps24 to pre-polymerized Snf7 spiral. Yellow overlays denote turns consisting of paired filaments, light blue overlays denote turns consisting of unpaired filaments. Right: height profile of the spiral taken at t = 41 s, with higher peaks (yellow) corresponding to paired filament turns, and lower peaks (light blue) corresponding to unpaired filament turns. Source data are provided as a Source Data file.

