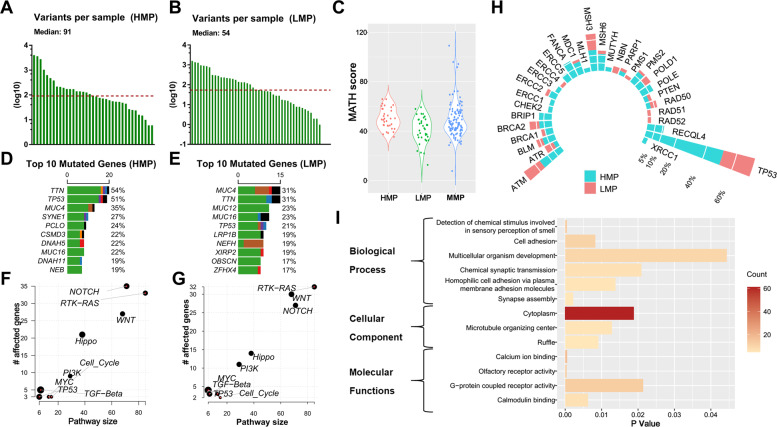
Fig. 2. Alterations landscape according to metastatic-potential.
Numbers of variants per sample in HMP group (A) and LMP group (B). C Intra-tumor genetic heterogeneity measured by MATH (Mutant-allele tumor heterogeneity). Top 10 mutated genes and their mutation rate in HMP group (D) and LMP group (E). Enrichment of known Oncogenic Signaling Pathways in HMP group (F) and LMP group (G). Each gene is represented as a dot, while their horizontal and vertical coordinates indicate numbers of genes in pathways and numbers of mutated genes in pathways, respectively. Sizes of dots represent the proportion of mutated genes in pathways. H The mutational rates of 35 genes known as DNA damage and repair genes in HMP group and LMP group. I Functional analysis of Gene Ontology (GO) analyzed the annotation of 176 candidate driver mutations.

