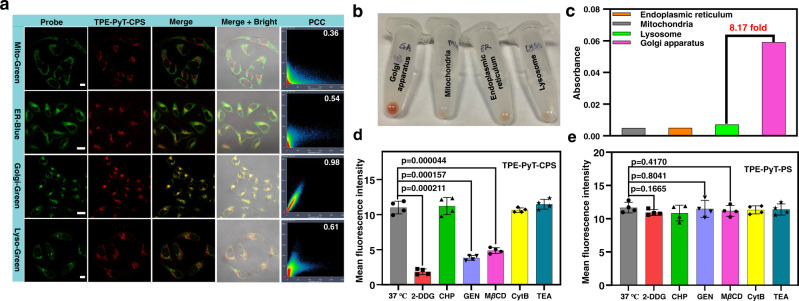
Fig. 4. Subcellular co-localization of TPE-PyT-CPS and the uptake behavior difference between TPE-PyT-PS and TPE-PyT-CPS.
a CLSM of HeLa cells stained with different commercial probes (Mito-Green: 495-535 nm, λex, 488 nm. ER-Blue: 455-520 nm, λex, 405 nm. Golgi-Green: 495-535 nm, λex, 488 nm. Lyso-Green: 495-535 nm, λex, 488 nm) and TPE-PyT-CPS (10 μM, 600-750 nm, λex, 488 nm). Scale bar: 20 μm for ER and Golgi channel;10 μm for Mito and Lyso channel. b Distribution images and UV absorption of TPE-PyT-CPS (c) in each organelle after separation by subcellular organelle kits. Average fluorescence intensity of HeLa cells after incubated with TPE-PyT-CPS (d) and TPE-PyT-PS (e) in the presence of different endocytosis inhibitors including 2-DDG, CHP, GEN, MβCD, CytB and TEA. Experiments in 4a were performed three times independently and experiments in 4b-c were performed two times independently, representative images are shown. Data in d and e are presented as mean ± SD derived from n = 4 biologically independent experiments. Statistically significant differences between the experimental groups were analyzed by two-tailed Student’s t-test. when p < 0.05, it was considered to have statistical significance. Source data are provided as a Source Data file.

